Geoscience Reference
In-Depth Information
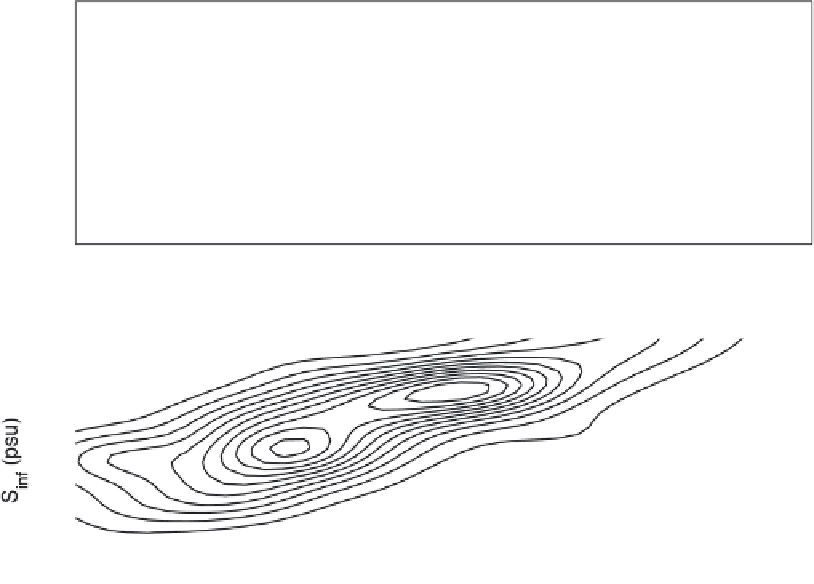
Figure 7.
Joint probability distributions of the temperature and salinity (top) near the surface and (bottom) near
thermocline for the data shown in Figure 3. For plotting purposes, the distributions are normalized to unity, 10 contour
lines shown in both plots are spaced by 0.1 with the maxima located in the centers. Both distributions have two maxima,
which we associate with the two states of the AMOC. Using the two-dimensional extension of the method developed by
Marron and Chaudhuri [1998], we estimated that the near-thermocline maxima are statistically significant at 90% level of
significance. The significance level of the surface maxima is lower.
In Figure 7, we show the joint distributions of these variables
for the surface and near-thermocline data. The two peaks
seen in both distributions may be interpreted as the weak and
strong states of the AMOC in accord with the modeling
findings by Schulz et al. [2007]. The weak state has a lower
salinity and slightly lower temperature compared with the
strong state.
The well-established solar activity quasiperiodicities are
positioned at 11 year solar cycle (a relatively short period-
icity in the paleocontext) and 90 years (the centennial
Gleissberg cycle). There is no direct solar irradiance (or
other solar variability proxy variations) at 1500 year oscil-
lation as shown by Debret et al. [2007], Dima and Loh-
mann [2009], Usoskin [2008], and by our data analysis. The
proposed mechanism is based on a simple physical idea of
the interaction (beats) of the 90 year solar signal with the
centennial ocean variability of the AMOC. We note that the
90 year cycle is a nonlinear oscillation not a sinusoid. We
also warn that
“
Gleissberg cycle
”
is a vague term used by
different authors to refer to different variations. It may have
a different meaning depending on what kinds of proxies are
used to identify it. Thus, Feynman and Fougere [1984]
identified a narrowband 90 year cycle in 1000 years of
aurora data (450
-
1450 A.D.), which directly represents the
solar variability. It is also seen in the solar cycle modulation
5. ON THE ORIGIN OF THE 1500 YEAR OSCILLATION
The origin of the 1500 year oscillation remains a matter of
debate. What has become clear and is supported by our data
analysis is that it could not be caused simply by direct solar
forcing as suggested earlier by Bond et al. [2001]. Combin-
ing the current ideas described in the introduction, we pro-
pose here a simple mechanism, which involves the solar and
ocean variability as well as a threshold effect in response to
the forcing.


Search WWH ::

Custom Search