Graphics Programs Reference
In-Depth Information
FIGURE 4-40
Using redundant
visual cues
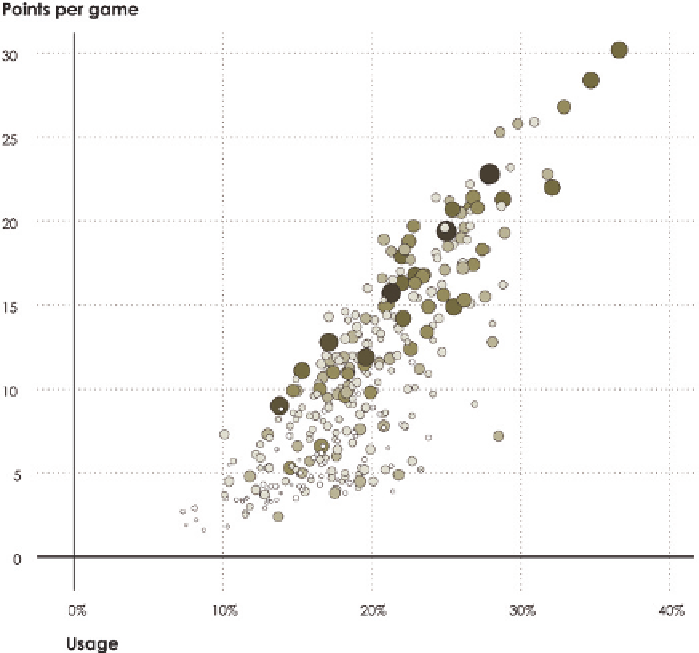
For example, if you were to go the opposite direction and use area and color to
represent two separate metrics, the plot could be difficult to read. Figure 4-41
shows the same values on the axes, usage percentage and points per game,
but uses area for rebounds and color for assists. Compare this to the previous
figure, and it's clear that the additional encodings don't make anything clearer.
MANY VARIABLES
Note:
You might be looking for a rule about
how many encodings you can use at the same
time before a visualization becomes useless,
but I'd be overgeneralizing. It depends on the
data. And the visualization. Experiment.
You might show four variables with a scatter plot, but what
about five variables? Ten variables? There's only so much
space in a scatter plot for so many visual cues. Unlike the
scatter plot, there are views that are more conducive to
comparing multiple variables at one time.
Search WWH ::

Custom Search