Graphics Programs Reference
In-Depth Information
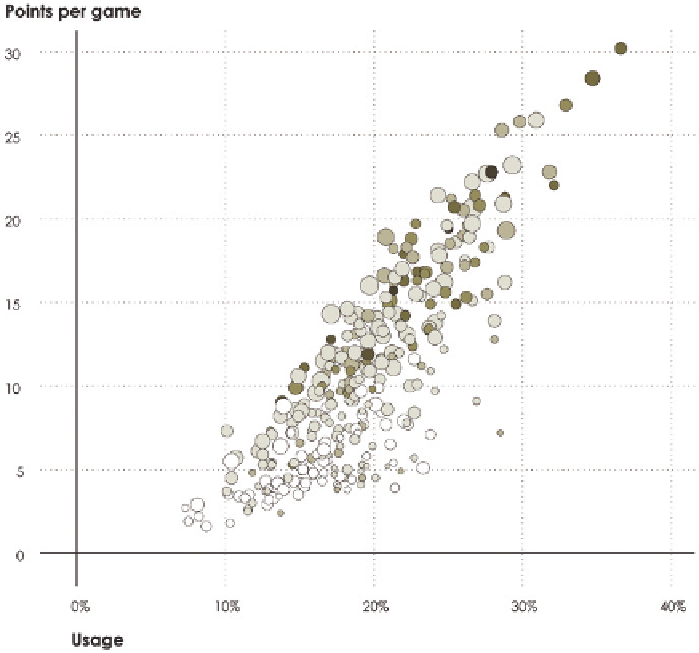
FIGURE 4-41
Multiple encodings
with a scatter plot
A heat map, as shown in Figure 4-42, can be used to translate a table to a set
of colors. It shows the same basketball player data, in addition to several other
variables, including number of games played, field goal percentage, and three-
point percentage. Each row represents a player, and darker shades represent
relatively higher values.
With players sorted alphabetically, it's hard to see patterns, but if you sort
by a column, say, points per game, as shown in Figure 4-44, relationships are
easier to see. For example, usage percentage and minutes are roughly dark
to light. On the other hand, the turnover rate appears to indicate a negative
correlation because it goes from light to dark, and games played, field goal
percentage, and three-point percentage look scattered, indicating a weak
correlation, if any.
Search WWH ::

Custom Search