Graphics Programs Reference
In-Depth Information
if you don't pay attention, and when you do mess up, people, especially on
the web, won't be afraid to call you out on it.
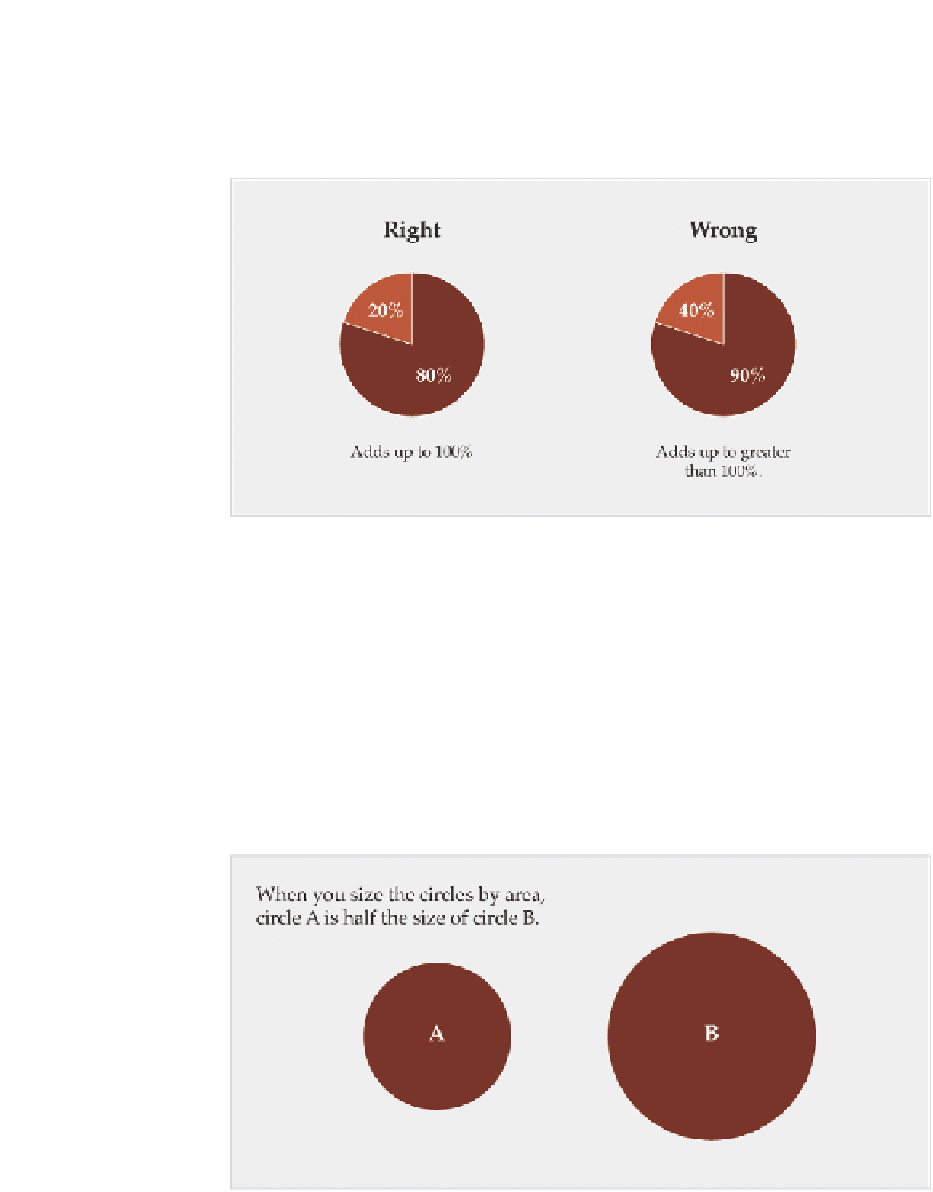
FIGurE 1-14
The right and wrong way to make a pie chart
Another common mistake is when designers start to use two-dimensional
shapes to represent values, but size them as if they were using only a sin-
gle dimension. The rectangles in a bar chart are two-dimensional, but you
only use one length as an indicator. The width doesn't mean anything. How-
ever, when you create a bubble chart, you use an area to represent values.
Beginners often use radius or diameter instead, and the scale is totally off.
Figure 1-15 shows a pair of circles that have been sized by area. This is the
right way to do it.
FIGurE 1-15
The right way to size bubbles

Search WWH ::

Custom Search