Graphics Programs Reference
In-Depth Information
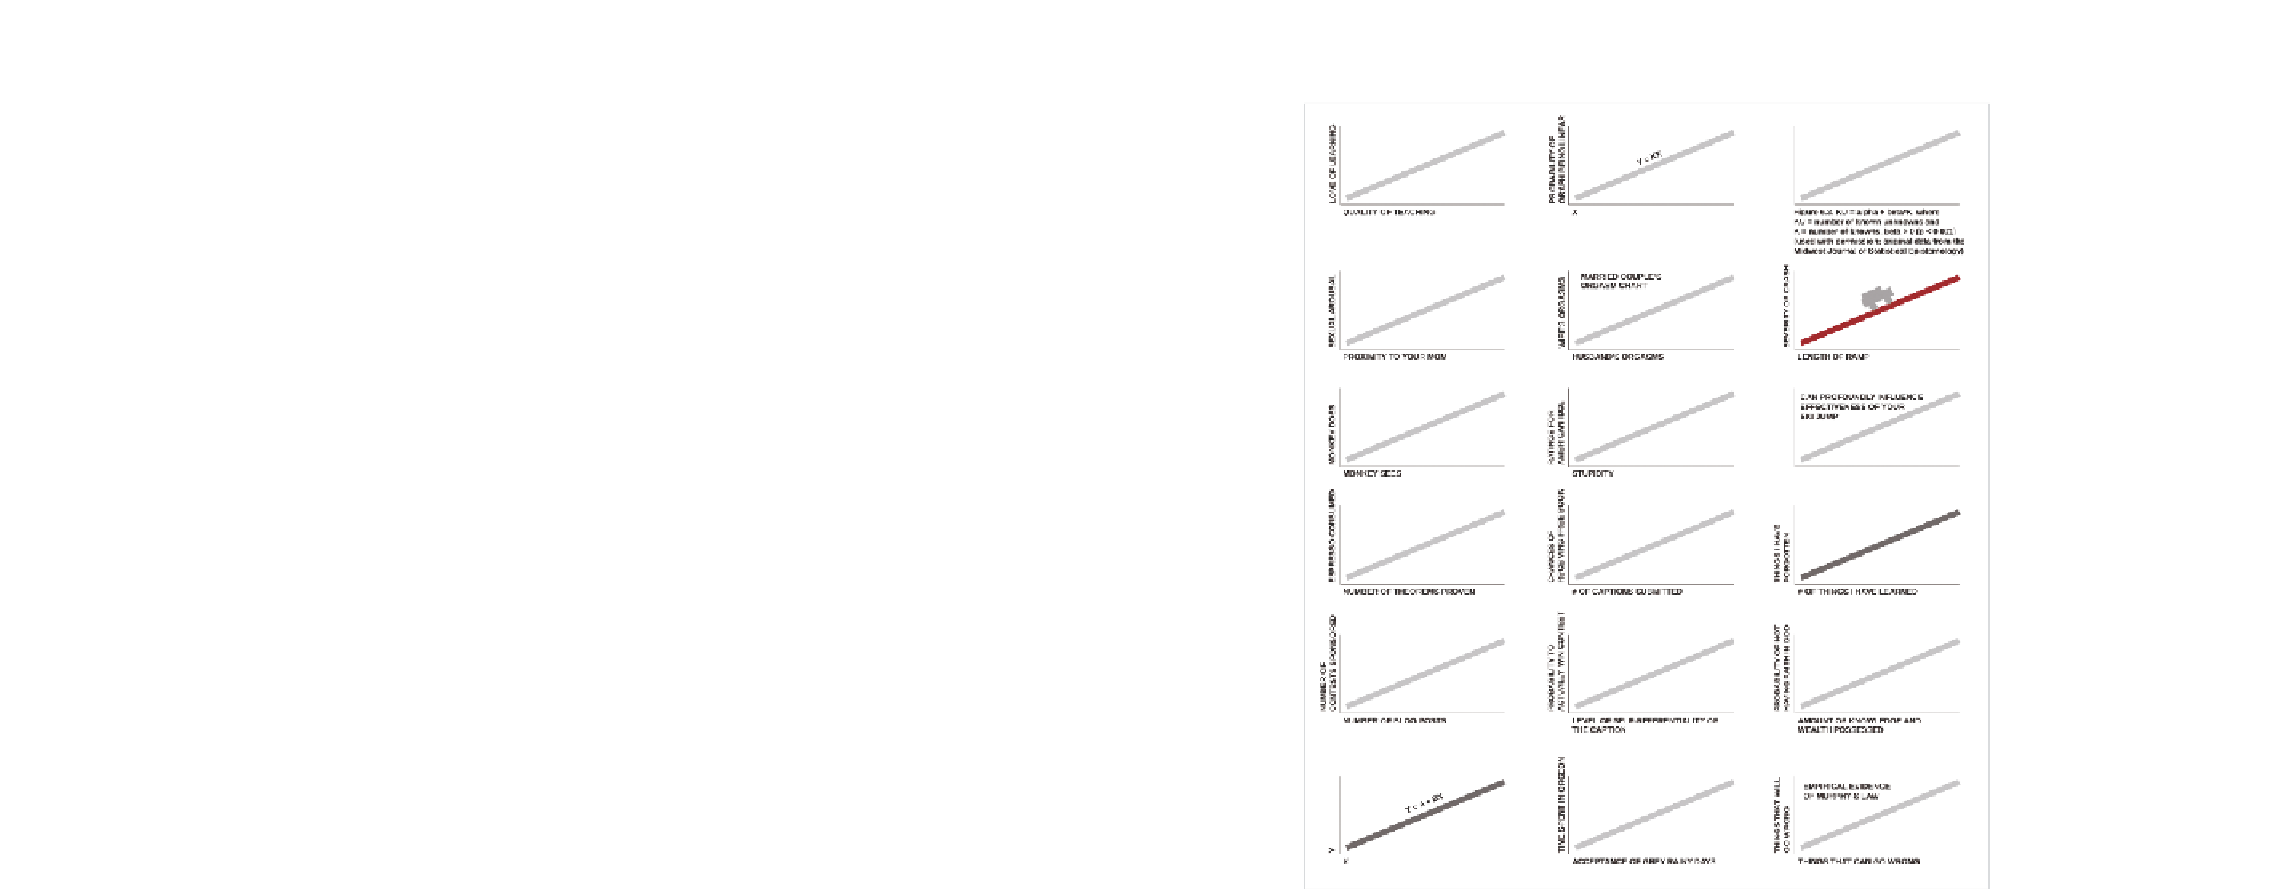
FIGurE 1-13
Some of the results from a caption contest on FlowingData
Keep Your Geometry in Check
When you design a graph, you use geometric shapes. A bar graph uses
rectangles, and you use the length of the rectangles to represent values.
In a dot plot, the position indicates value—same thing with a standard time
series chart. Pie charts use angles to indicate value, and the sum of the
values always equal 100 percent (see Figure 1-14). This is easy stuff, so be
careful because it's also easy to mess up. You're going to make a mistake

Search WWH ::

Custom Search