Graphics Programs Reference
In-Depth Information
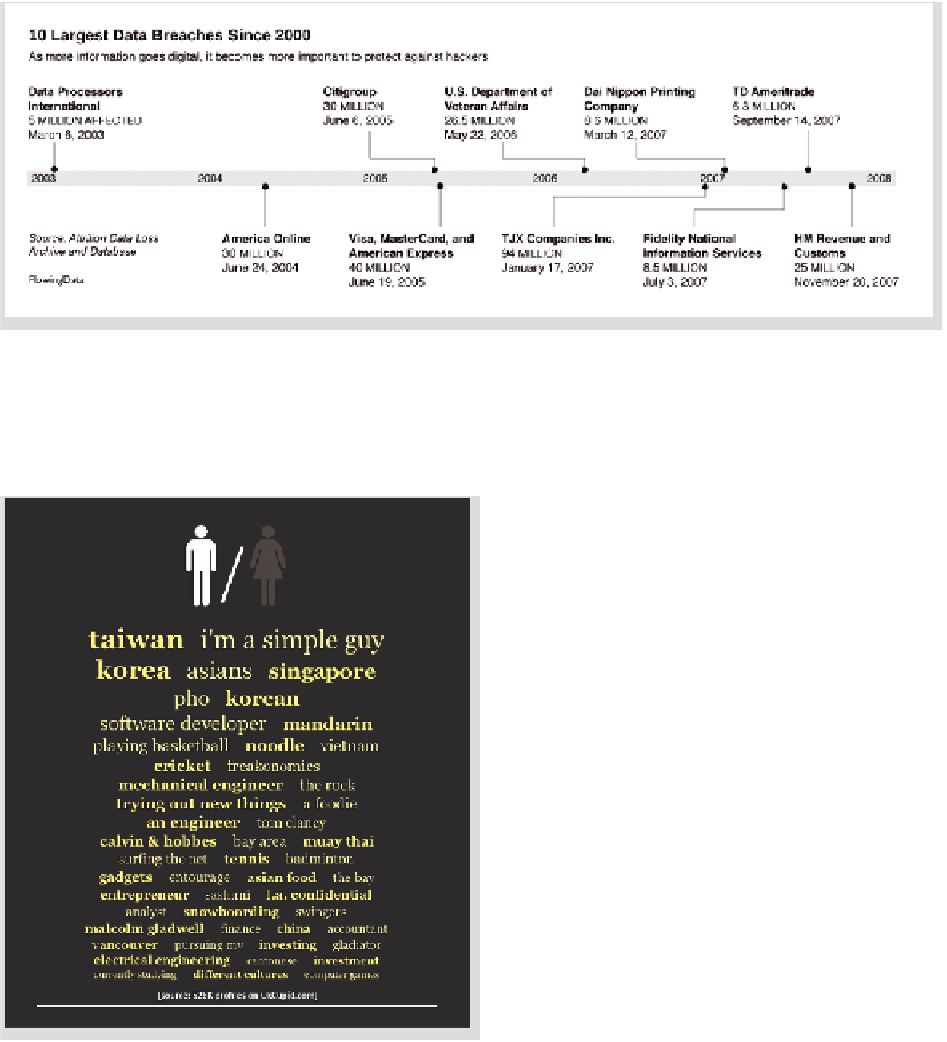
FIGurE 9-4
Major data breaches since 2000
The lesson: Don't assume your readers know everything or that they can
spot features in your graphic. This is especially true with the web because
people are used to clicking to the next thing.
That's not to say that people won't spend time
looking at data. As you might have seen, the
OkCupid blog has been writing relatively long
posts presenting results from thorough analy-
ses of its online dating dataset. Titles include
“The Best Questions for a First Date” and “The
Mathematics of Beauty.”
Posts on the blog have been viewed millions
of times, and people love what the OkCupid
folks have to say. In addition to the tons of
context in the actual post, people also come
to the blog with a bit of context of their own.
Because it is data and findings about dating
and the opposite sex, people can easily relate
with their own experiences. Figure 9-5, for
example, is a graphic that shows what Asian
guys typically like, which is from an OkCupid
post on what people like, categorized by race
and gender. Hey, I'm Asian
and
a guy. Instant
connection.
FIGurE 9-5
What Asian guys like based on OkCupid online
dating profiles


Search WWH ::

Custom Search