Graphics Programs Reference
In-Depth Information
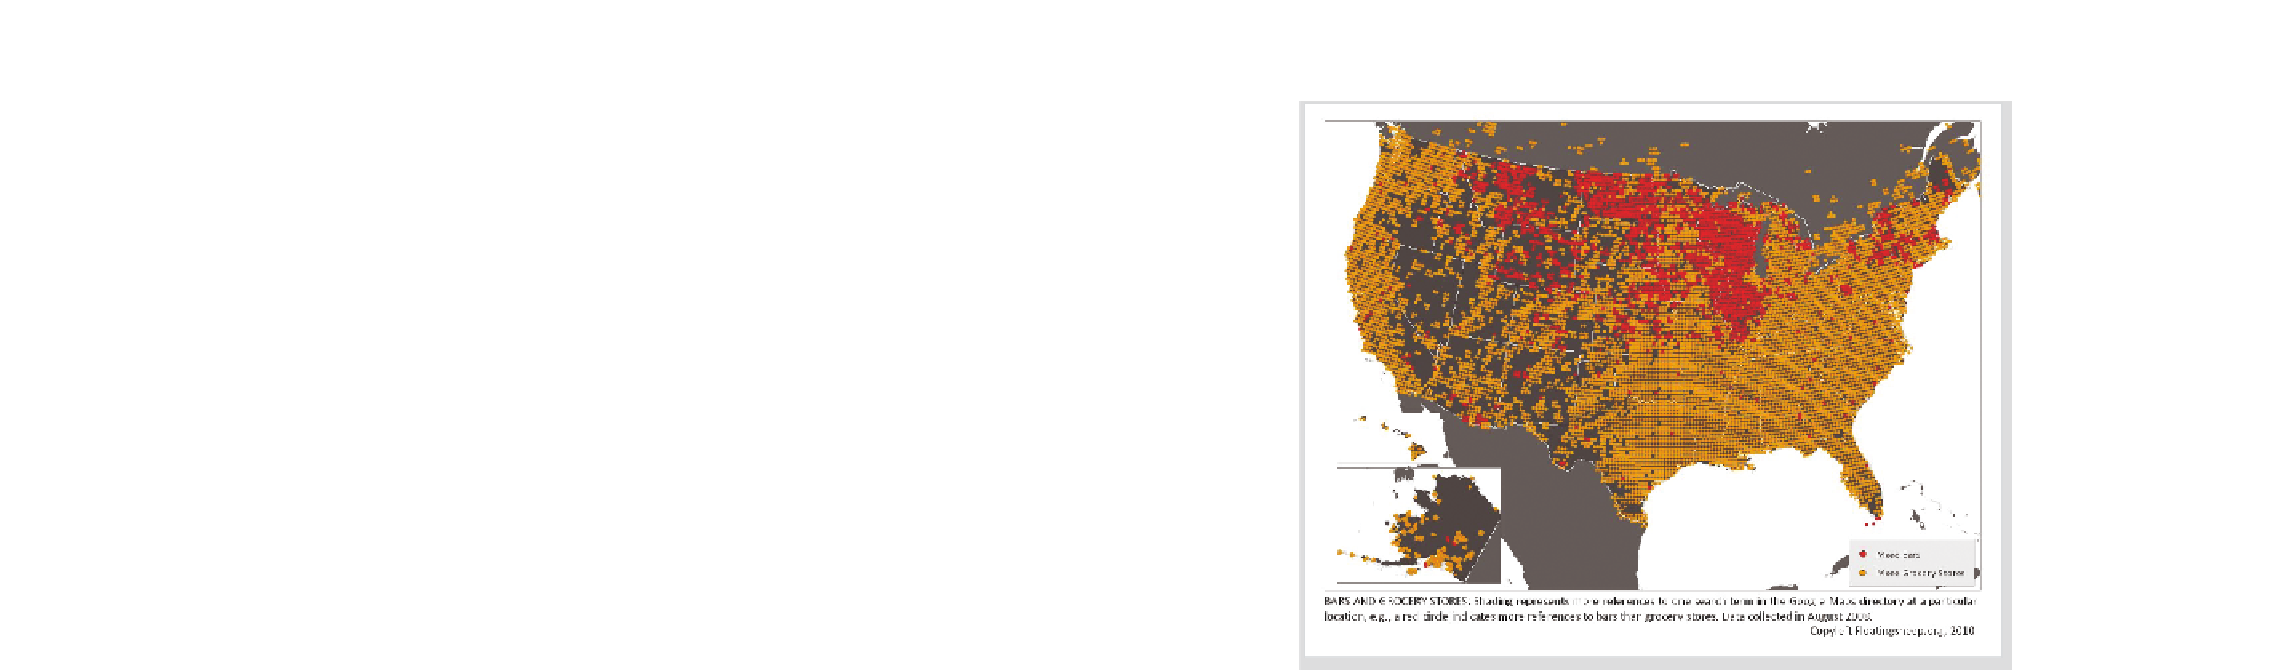
FIGurE 9-6
Where bars outnumber grocery stores in the United States
On the other hand, when your graphic's topic is pollution levels or global
debt, it can be a tough sell to a general audience if you don't do a good job
of explaining.
Sometimes, no matter how much you explain, people simply don't like to
read online, and they'll just skim. For example, I posted a map by Float-
ingSheep that compares number of bars to number of grocery stores in
the United States, as shown in Figure 9-6. Red indicates areas where there
are more bars than grocery stores, and orange indicates vice versa. The
FloatingSheep guys called it the “beer belly of America.”
Toward the end of the post, I wondered about the accuracy of the map
and then finished up with, “Anyone who lives in the area care to confirm? I
expect your comment to be filled with typos and make very little sense. And
maybe smell like garbage.” The lesson? Dry humor and sarcasm doesn't
translate very well online, especially when people aren't used to reading
your writing. I didn't actually expect comments to smell like garbage. Most


Search WWH ::

Custom Search