Graphics Programs Reference
In-Depth Information
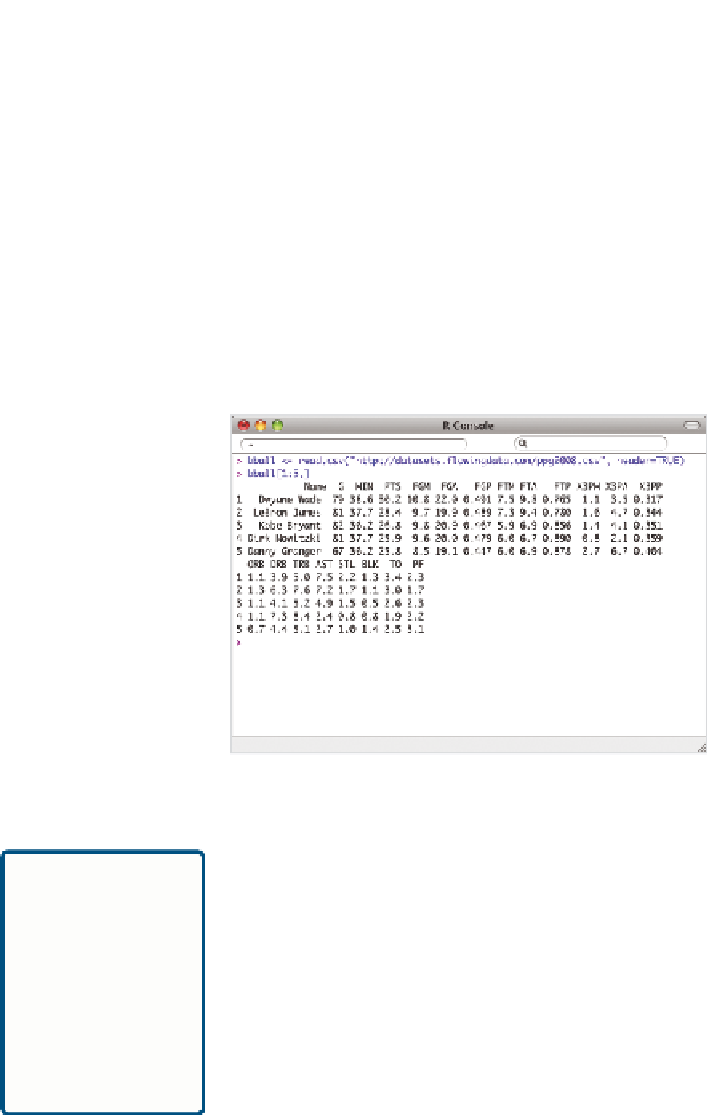
In this example, take a look at NBA basketball statistics for 2008. You can
download the data as a CSV file at
http://datasets.flowingdata.com/ppg2008
.csv
. There are 22 columns, the first for player names, and the rest for
stats such as points per game and field goal percentage. You can use
read
.csv()
to load the data into R. Now look at the first five rows to get a sense
of the data's structure (Figure 7-2).
bball <-
read.csv(“http://datasets.flowingdata.com/ppg2008.csv”,
header=TRUE)
bball[1:5,]
The
decreasing
order()
specifies
whether you want
the data to be
sorted in ascend-
ing or descending
order.
argument in
FIGurE 7-2
Structure of the first five rows of data
Players are currently sorted by points per game, greatest to least, but you
could order players by any column, such as rebounds per game or field
goal percentage, with
order()
.
The
decreasing
argument in
order()
specifies
whether you want
the data to be
sorted in ascend-
ing or descending
order.
bball_byfgp <- bball[order(bball$FGP, decreasing=TRUE),]
Now if you look at the first five rows of
bball_byfgp
, you see the list is led by
Shaquille O'Neal, Dwight Howard, and Pau Gasol instead of Dwyane Wade,
Lebron James, and Kobe Bryant. For this example, reverse the order on
points per game.
bball <- bball[order(bball$PTS, decreasing=FALSE),]


Search WWH ::

Custom Search