Graphics Programs Reference
In-Depth Information
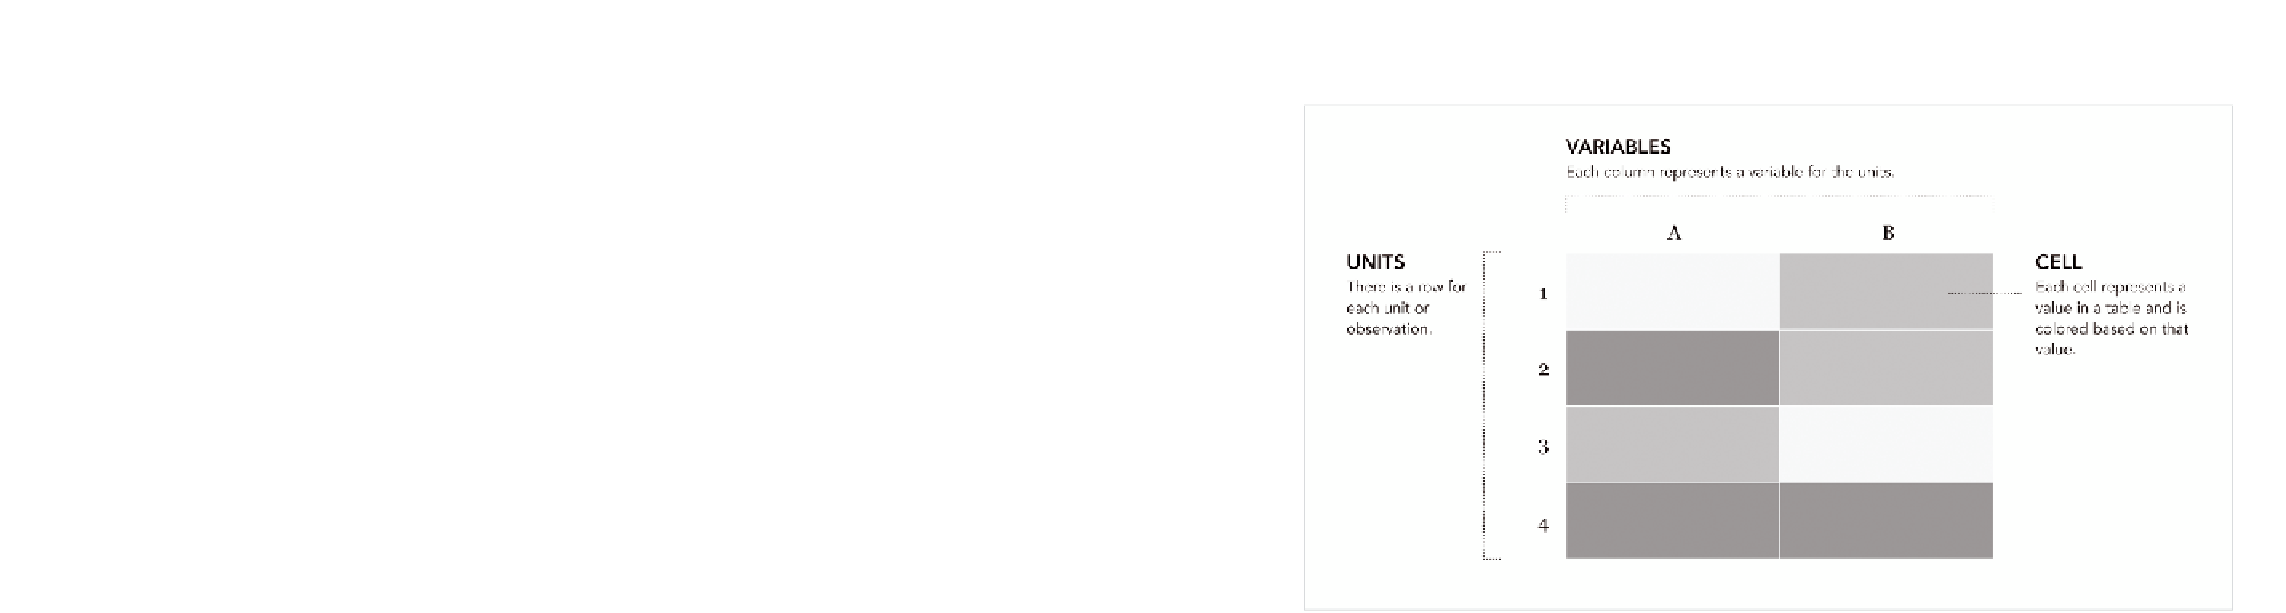
FIGurE 7-1
Heatmap framework
You end up with a grid the same size of the original data table, but you can
easily find relatively high and low values based on color. Typically, dark
colors mean greater values, and lighter colors represent lower values but
that can easily change based on your application.
You also read the heatmap (or heat matrix) the same way you would a table.
You can read a row left to right to see the values of all variables for a single
unit, or you can see how all the units compare across a single variable.
This layout can still confuse you, especially if you have a large table of
data, but with the right color scheme and some sorting, you can make a
useful graphic.
CrEATE A hEATMAP
It's easy to make heatmaps in R. There's a
heatmap()
function that does all
the math work, which leaves you with picking colors best suited for your
data and organizing labels so that they're still readable, even if you have a
lot of rows and columns. In other words, R sets up the framework, and you
handle the design. That should sound familiar by now.

Search WWH ::

Custom Search