Graphics Programs Reference
In-Depth Information
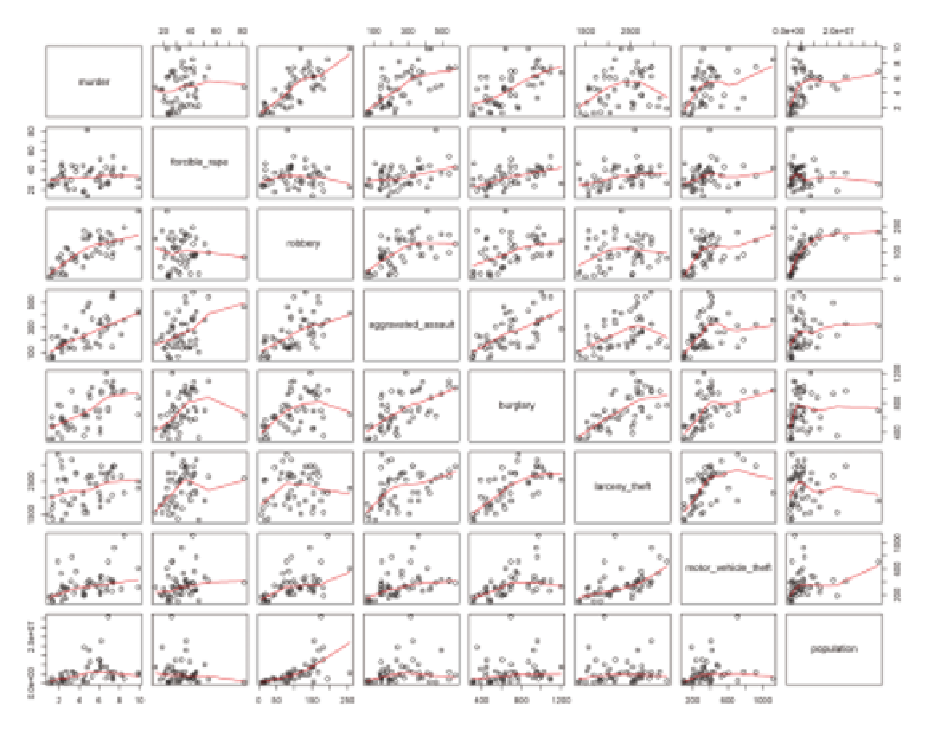
FIGurE 6-11
Scatterplot matrix with LOeSS curves
Bubbles
P
Check out Hans
Rosling's now fa-
mous talks on the
Gapminder site at
www.gapminder
.org
, including a
BBC documen-
tary on the joy of
statistics.
ever since Hans Rosling, Professor of International Health at Karolinska
Institute and chairman of the Gapminder Foundation, presented a motion
chart to tell his story of the wealth and health of nations, there has been
an affinity for proportional bubbles on an x-y axis. Although the motion
chart is animated to show changes over time, you can also create a static
version: the bubble chart.
A bubble chart can also just be straight up proportionally sized bubbles,
but now consider how to create the variety that is like a scatterplot with a
third, bubbly dimension.


Search WWH ::

Custom Search