Graphics Programs Reference
In-Depth Information
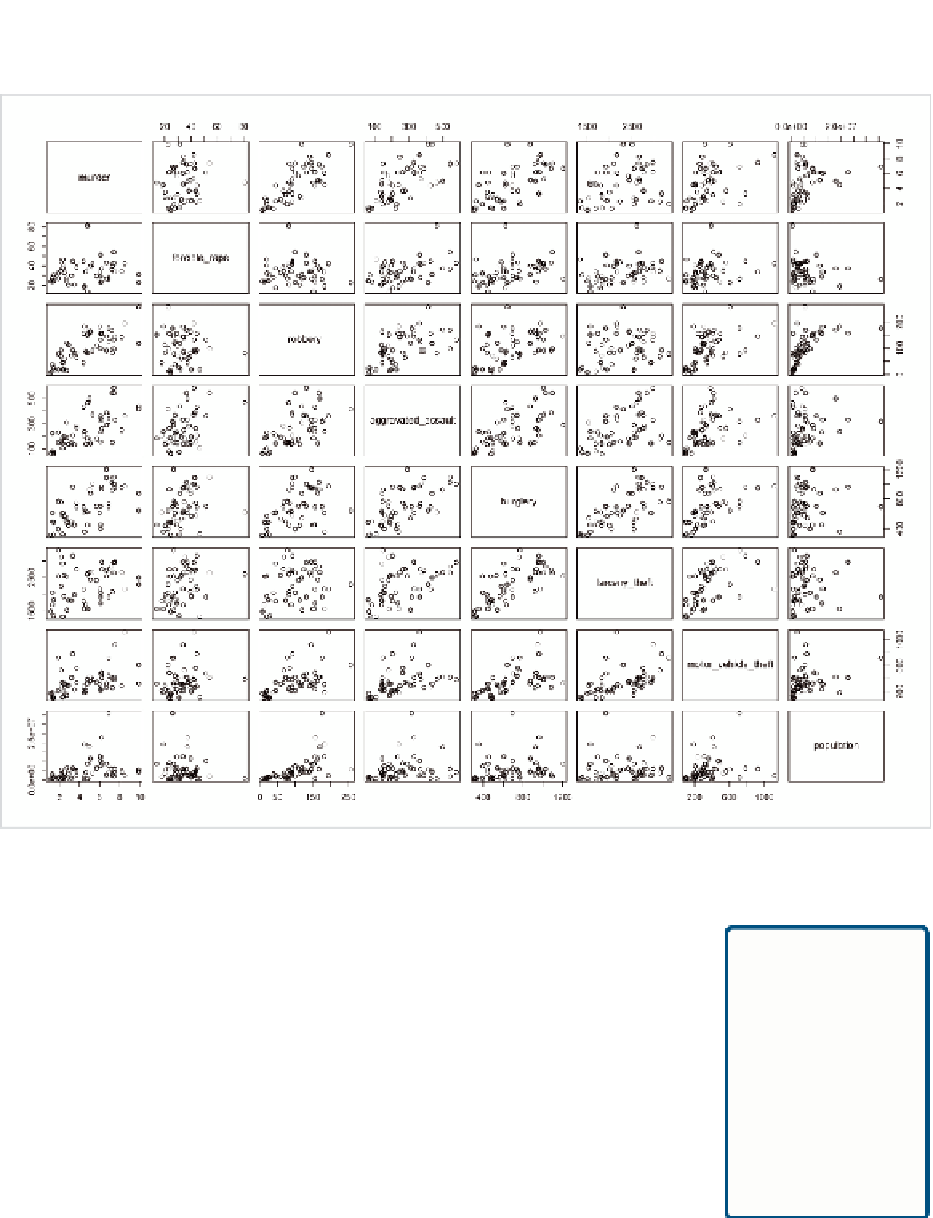
FIGurE 6-10
Default scatterplot matrix in R
Now you have a nice framework to work off of, and you can edit it further
to make it more readable (refer to Figure 6-9). Save the graphic as a PDF
and open the file in Illustrator.
Decide what
part of the story
you want to tell
and design
your graphic to
emphasize those
areas, but also
take care not to
obscure facts.
Mainly, you need to get rid of clutter and make it easier to see what's impor-
tant. That's the crime types and trend lines first, the points second, and the
axes last, and you should see that order in the choice of color and sizes. The
size of the labels across the diagonal increase, and the boxes are grayed
out. Then make the trend lines thicker and provide more contrast between
the lines and the dots. Finally, the borders and grid lines are made more
subtle with a thinner stroke width and lighter gray. Compare Figure 6-9 to
Figure 6-11. There's a lot less visual vibration in Figure 6-9, right?


Search WWH ::

Custom Search