Graphics Programs Reference
In-Depth Information
Because of this, the value axis of scatterplots doesn't always have to start
at zero, but it's usually good practice.
CrEATE A SCATTErPLoT
R makes it easy to create a scatterplot via the
plot()
function, but you can
use variations, depending on what data you look at. Figure 4-25 shows the
final graphic.
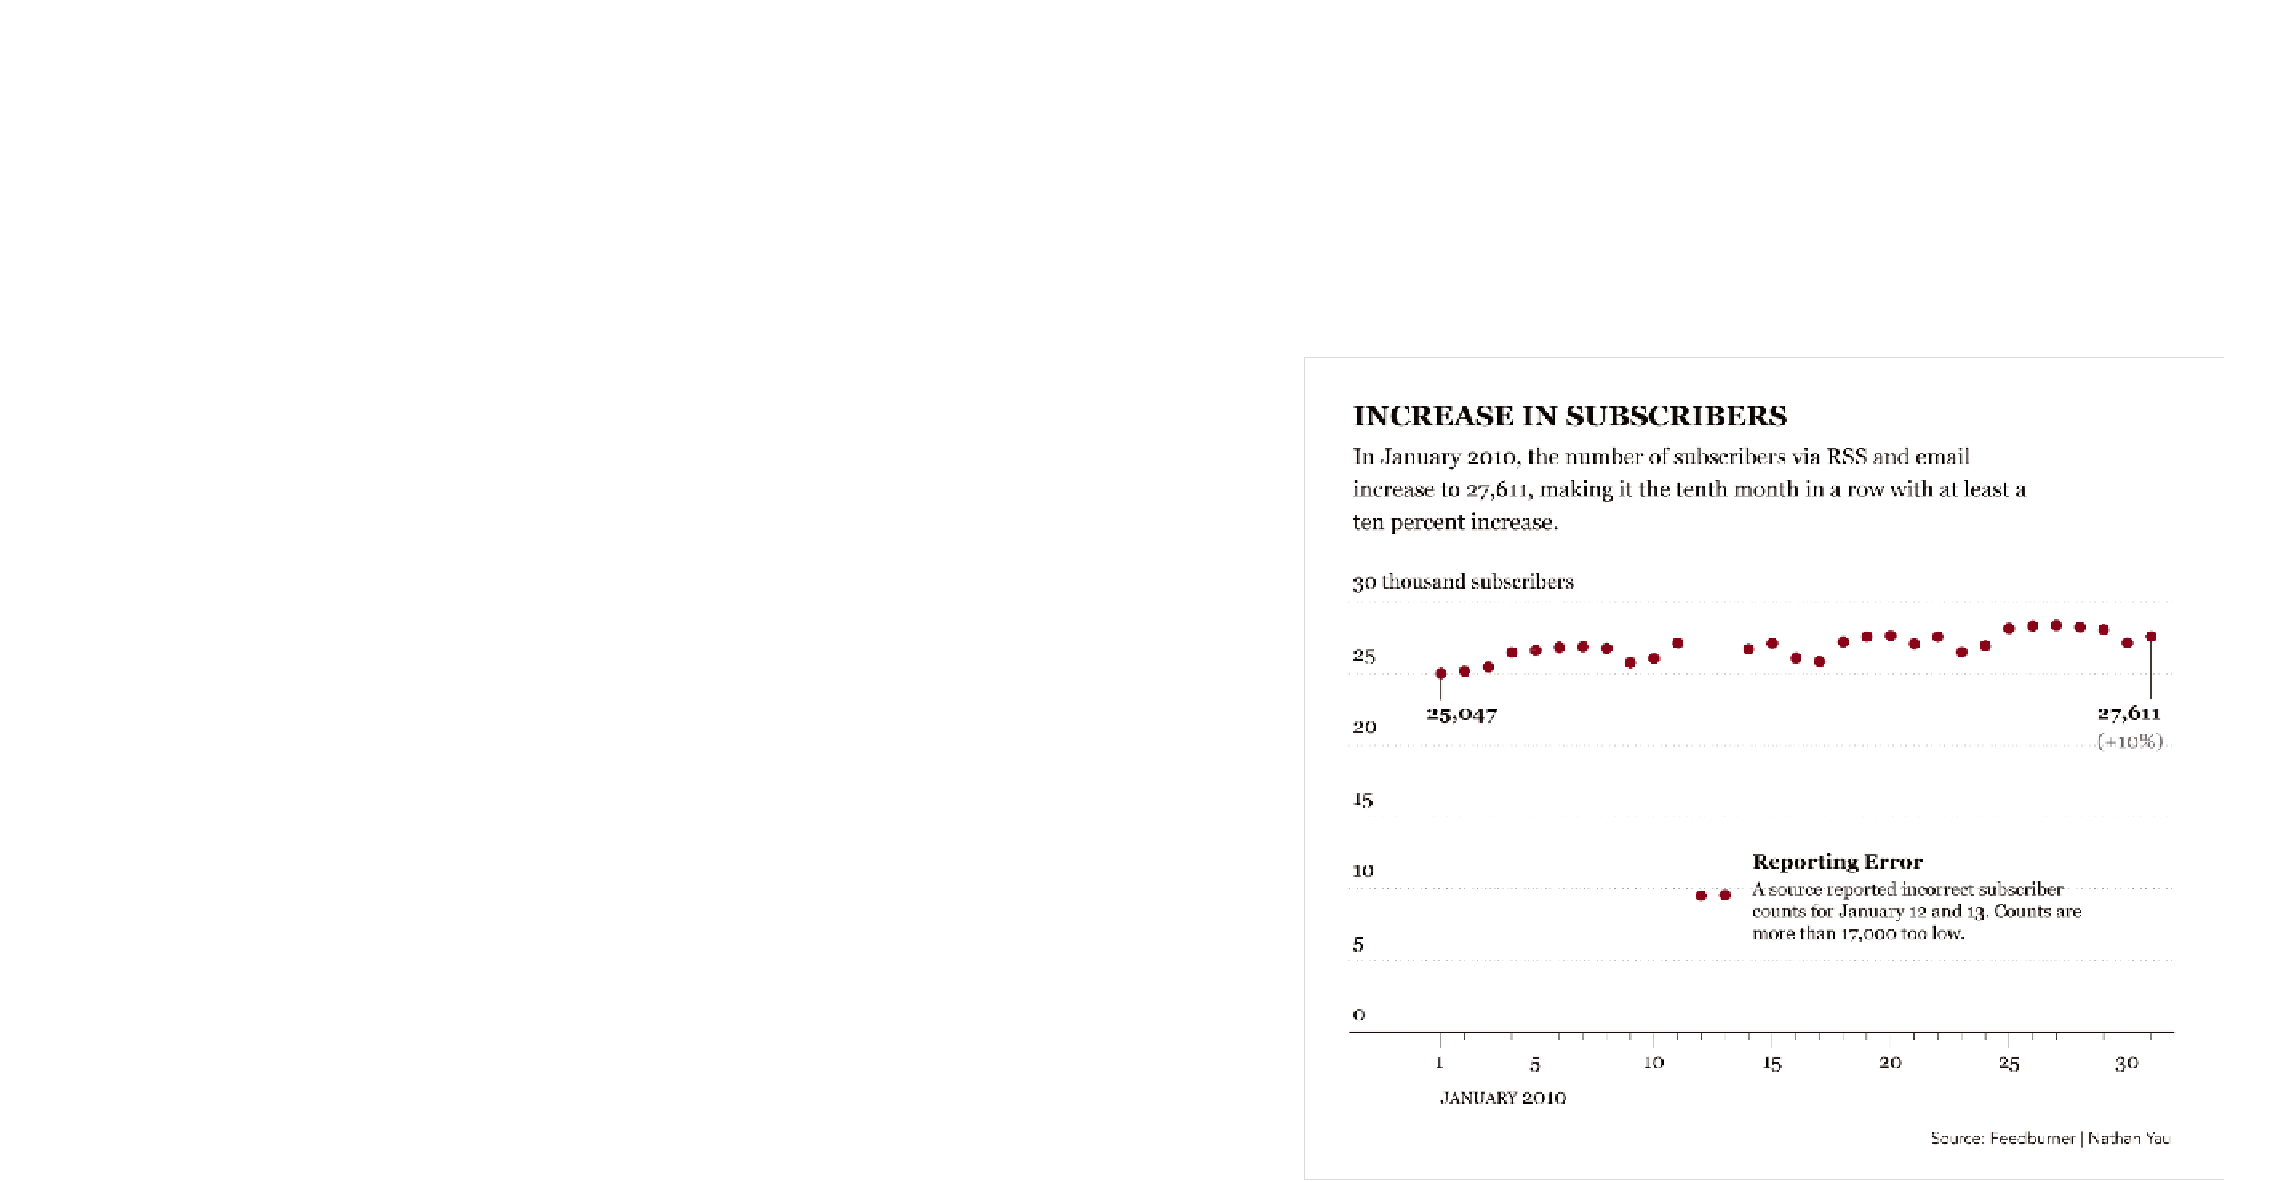
FIGurE 4-25
Scatterplot created in R and designed in Illustrator

Search WWH ::

Custom Search