Geoscience Reference
In-Depth Information
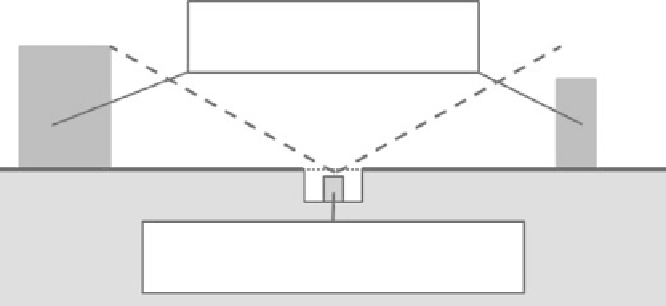
Surrounding obstructions subtend
an angle of less than 30
with
respect to the ground.
30
Gauge set in pit with top at ground level,
surrounded by a plastic grid to simulate the
aerodynamic roughness of surrounding area.
Figure 26.9
Preferred
arrangement for a rain gauge site.
Percentage precipitation per month for tucson
Jan.
Feb.
March.
Apr.
May.
June.
July.
Aug.
Sept.
Oct.
Nov.
Dec.
10%
8%
6%
6%
6%
10%
3%
2%
2%
Figure 26.10
Monthly-average
precipitation for the months
January through December
for Tucson over the period
1961-1990 plotted as a pie
diagram.
6%
21%
20%
(b) Over the period 1961-1990 the monthly average precipitation for the
months January through December for Tucson were 0.87, 0.7, 0.72, 0.30,
0.18, 0.20, 2.35, 2.19, 0.67, and 1.07 inches, respectively. The seasonality
index calculated using Equation (13.1) from these values is 0.55, which
implies a rainfall regime that is fairly seasonal.
(c) The monthly average precipitation for the months January through
December for Tucson given in (b) are plotted as a pie diagram in Fig. 26.10.
(d) The percentage mass curve for the rainstorm is given in Fig. 26.11. About
50% of the rain during this storm falls in the first quarter of the storm and
about 90% in the first half of the storm which suggests the storm is of con-
vective origin.
(e) The mean value of July Tanzanian rainfall for the years 1931 to 1960 is
24.57 mm while the median value is 6.5 mm. The large difference between
these two is because the probability distribution is so heavily skewed, see
Figure 13.3.
(f ), (g), and (h) The required plots of 7-year running mean, mass curve, and
cumulative deviation for Tanzanian July rainfall data are given in Fig. 26.12
(i) The area-average precipitation values the farmer calculated for his field in
April, May, and June were 9.26, 36.18, and 42.47 mm, respectively.