Geoscience Reference
In-Depth Information
Percentage mass curve
100
80
60
40
20
Figure 26.11
Mass curve for
the precipitation during a
storm measured using a siphon
rain gauge, see Fig. 26.2 and
Table 26.2.
0
0
20 40 60
Percentage of time during storm
80
100
(a)
(b)
800
80
7-year running mean
Mass curve
700
600
70
60
50
500
400
40
300
200
30
20
10
100
0
0
(c)
100
Cummulative deviation
50
0
1
6
11
16
21
26
−
50
−
100
−
150
−
200
−
250
−
300
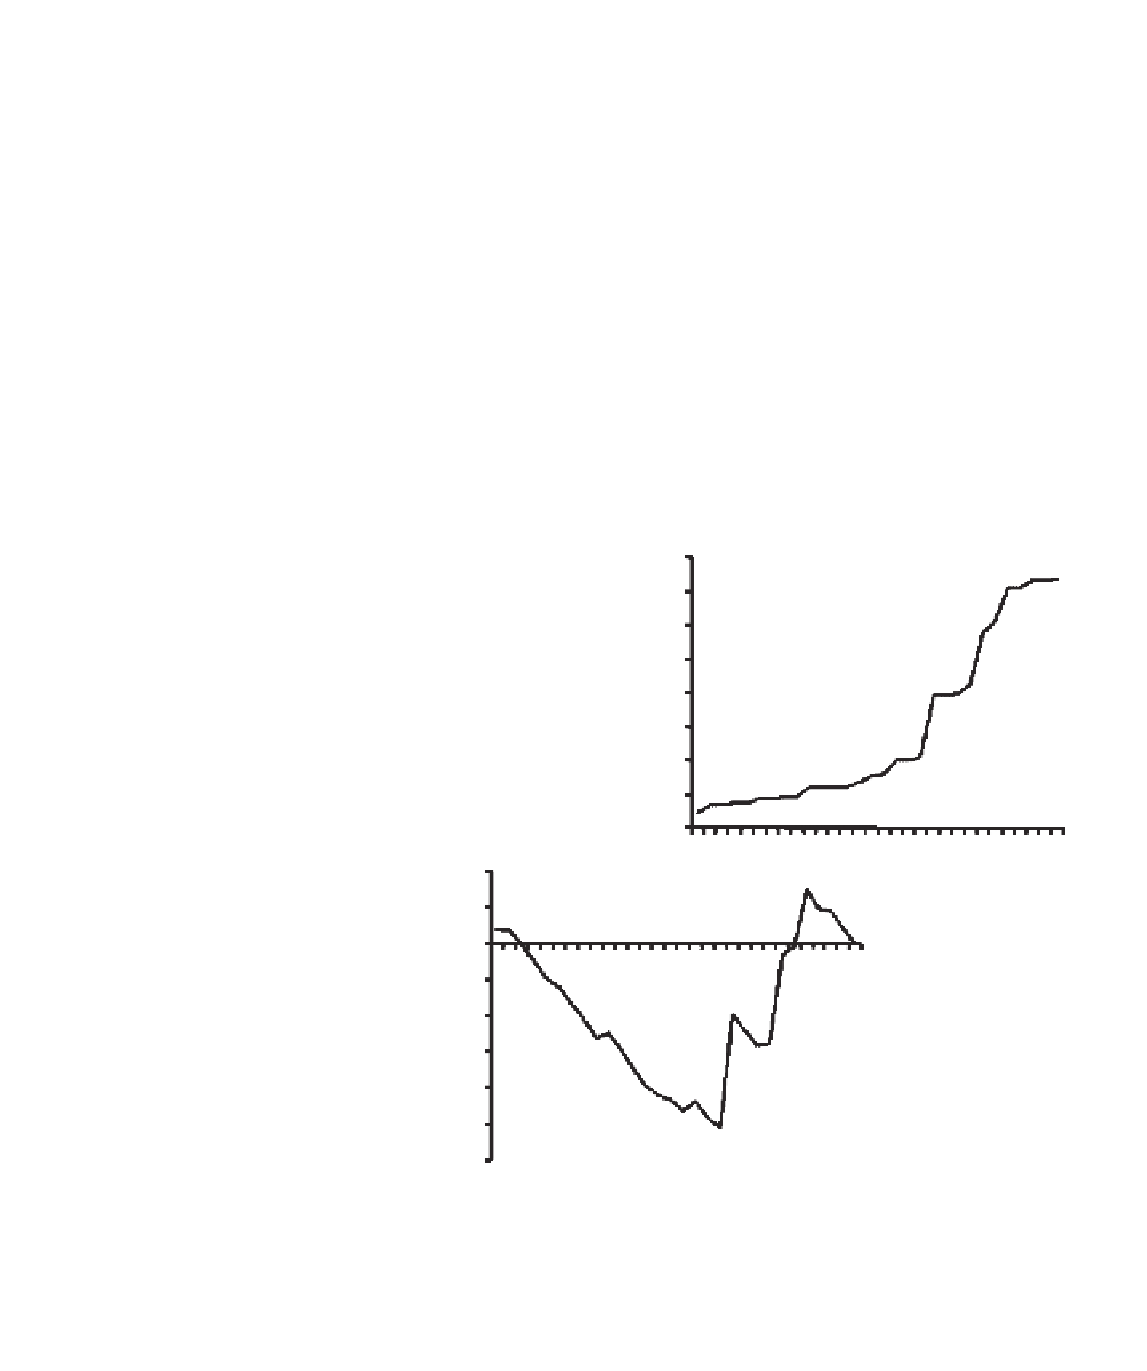
Figure 26.12
The required (a) 7-year running mean values, (b) mass curve, and (c) cumulative deviation for Tanzanian
July rainfall data given Table 13.3 (a).