Geoscience Reference
In-Depth Information
120
108
96
84
72
60
48
36
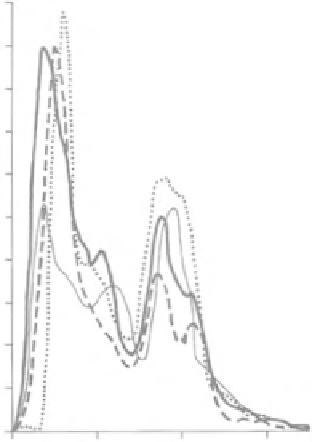
Figure 13.8
Rainfall
intensity through a convective
storm measured at four sites
in Kampala, Uganda.
(Redrawn from Sumner,
1988, published with
permission.)
24
12
0
0
20
Time after start (minutes)
40
60
(a)
(b)
50
Convective storms
100
40
80
30
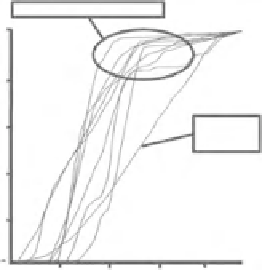
Figure 13.9
(a) Mass curve
for a frontal storm in
Lampeter, Wales; (b)
Percentage mass curve for
eight convective storms and
one frontal storm in Dar es
Salaam, Tanzania. (Redrawn
from Sumner, 1988, published
with permission.)
60
Frontal
storm
20
40
10
20
0
0
18:00
24:00
06:00
0 0 0 0 0
Percentage of total time
5 Aug. 1973
6 Aug. 1973
Date and time
Intensity-duration relationships
Observations of rainfall intensity suggest that there exists a basic, inverse, non-
linear relationship between different intensities of rainfall and the duration over
which different rainfall intensities persist. Most analysis of rainfall intensity has
been directed at the occurrence of maximum intensity over different durations
because this gives a measure of extreme precipitation at the location of interest. As
discussed later, probabilities may be assigned to such extreme values so that likely
volumes of rainfall over an area may be estimated and interpreted in terms of