Geoscience Reference
In-Depth Information
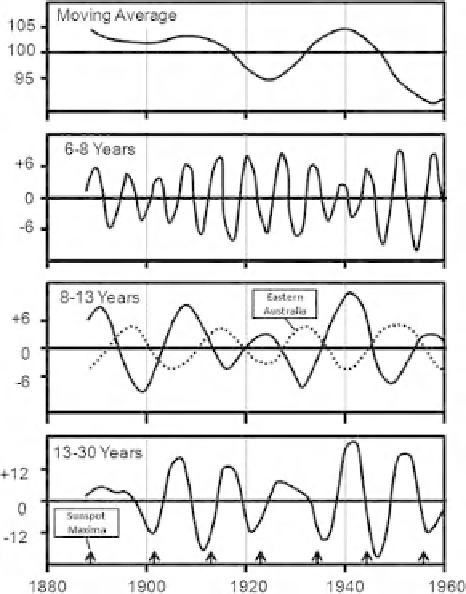
Figure 13.7
Fluctuations in
annual rainfall from 1887 to
1960 for the west coast of the
USA when subject to filters
(described in the text) shown
as full lines. Also shown (as
broken lines) are results using
data from eastern Australia.
(Adapted from Vines, 1982.)
storm is usually different. Longer duration events tend to have a relatively even
distribution of precipitation with time, or to have higher intensity precipitation
toward the end of the storm. On the other hand, shorter duration events which are
mostly convective in origin tend to have more intense rainfall near the start of the
storm associated with a downdraft, although if there are several intense cells in the
storm, the pattern is more complex. Figure 13.8 gives the precipitation rate through
a single convective storm measured at four sites and shows a characteristic higher
rainfall rate near the beginning of the storm with a second less intense cell passing
the gauges about 30 minutes later.
Because precipitation events with similar origin have different rainfall totals
and different duration, when comparing several storms it is convenient to
re-normalize the mass curve such that the Y axis displays the percentage of total
rainfall and the X axis the percentage of time through the storm. Figure 13.9a
shows an example mass curve for a frontal storm without re-normalization, while
Fig. 13.9b compares the percentage mass curves for several storms most of which
are convective in nature, but one of which is frontal in nature. Approximately
speaking, for convective storms about 50% of the total storm rainfall falls in the
first quarter of the storm and 90% within the first half of the storm. In contrast,
because the rainfall rate is more uniform, only about half of the storm rainfall falls
in the first half of frontal storms.