Geoscience Reference
In-Depth Information
(a)
200
150
100
50
0
1931
1936
1941
1946
Year
1951
1956
(b)
200
150
100
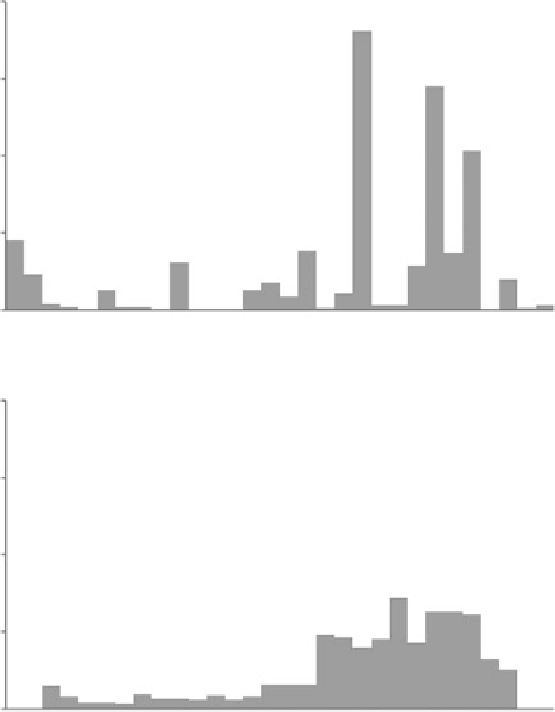
Figure 13.4
(a) Time series
of total July precipitation at
Musoma, Tanzania between
1931 and 1960 given in Table
13.1; (b) Five-year running
mean of these same data.
50
0
1931
1936
1941
1946
Year
1951
1956
and indicates there was a marked change in annual precipitation in the decade
1901-1910, with some indication of a reversal in this trend beginning in the
1930s or 1940s.
Mass curve
The mass curve approach is an alternative way to reveal long-term sustained
trends. Here the analysis involves accumulating and plotting total precipitation
throughout the data period. The accumulated precipitation total plotted for year
j
is given for the precipitation time series,
P
i
, by:
j
=
∑
(13.7)
P
P
jm
,
i
i
=
1