Geoscience Reference
In-Depth Information
20
15
10
5
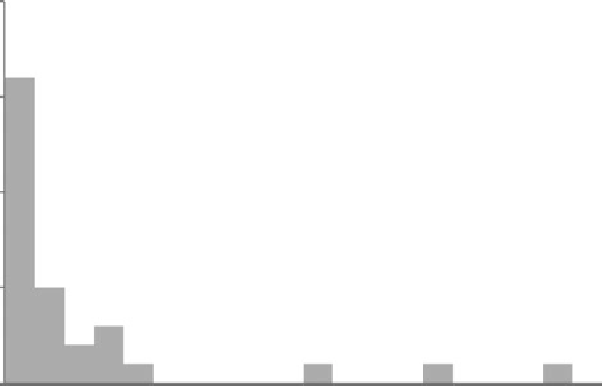
Figure 13.3
Frequency
distribution for the July
precipitation at Musoma,
Tanzania from 1931 to 1960
given in Table 13.1.
0
0
10 20 30 40
50
60 70 80
Monthly rainfall (mm)
90 100 110 120 130 140 150 160 170 180 190
This series is valid for values of
i
in the range (
n+1)
to (
N-n-1
), where
N
is the
number of data elements in the original time series. Figure 13.4a shows the time
series of values of total July precipitation at Musuma, Tanzania and Fig. 13.4b the
time series of the 5-year running average value of these same data. The year-to-
year fluctuations in Fig. 13.4b are much smoother than in Fig. 13.4a, and a trend
toward a wetter period during the 1950s clearly emerges.
Cumulative deviations
Significant and sustained shifts in precipitation can be demonstrated by accumu-
lating the deviations in yearly precipitation about the period mean. Yearly devia-
tions above (positive) or below (negative) the period mean are accumulated
through the data period, either as absolute amounts or as percentages of the mean
precipitation. A plot is then made as a function of time of the accumulated devia-
tions,
P
j,a
, or the accumulated percentage residuals,
P
j,p
, given by:
j
∑
P
=
(
P
−
P
)
(13.5)
ja
,
i
i
=
1
and:
j
100
∑
P
=
(
P
−
P
)
(13.6)
jp
,
i
P
i
=
1
where
P
i
are the time series of precipitation undergoing analysis and
is the
mean precipitation for the period of interest. Figure 13.5 shows the results of a
cumulative percentage analysis for annual precipitation at several tropical sites
P