Geoscience Reference
In-Depth Information
90N
a
gm kg
-1
2
4
60
6
8
10
12
30
6
14
16
18
18
EQ
18
18
16
18
14
8
14
12
6
10
30
10
8
6
4
60
Near-surface
specific humidity
2
(a)
90S
180
120
60W
0
60E
120
180
90N
90N
0.5
gm kg
-1
0.25
1
60
60
1.5
1.5
1
2
2
1
2
2.5
1
1
3
30
30
3
4
4
5
4.5
4.5
4.5
5
5
EQ
EQ
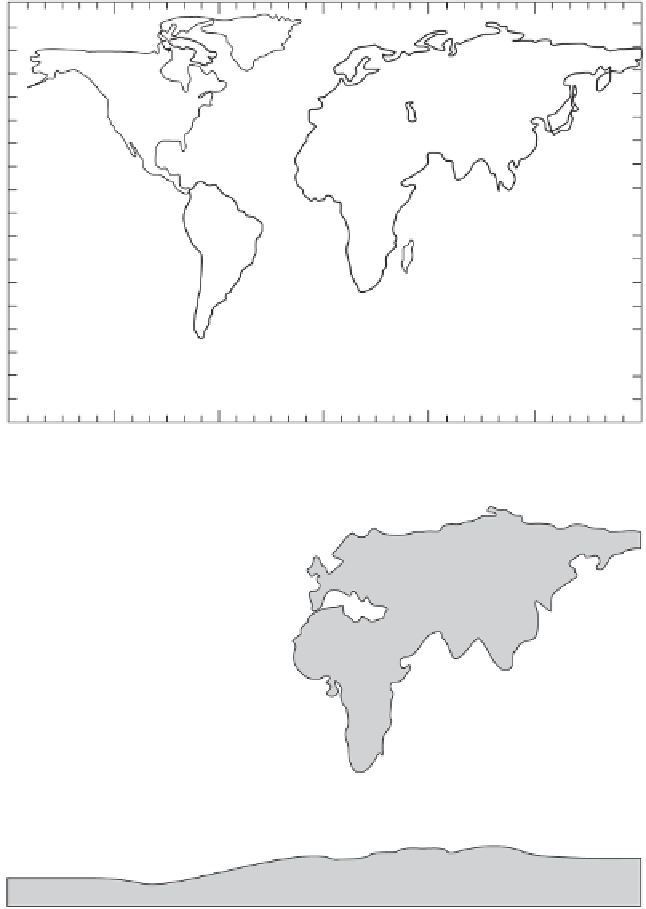
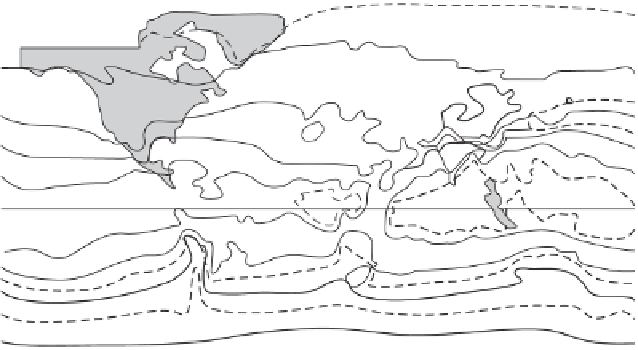
Figure 9.15
Global
distributions of annual
average (a) near-surface
specific humidity in units
of g kg
−1
; and (b) vertical
average specific humidity
in units of g kg
−1
.
(Redrawn from Peixoto
and Oort, 1992, published
with permission.)
4.9
4
4.5
4.5
4
4
3
3
2.5
30
30
2
1.5
1
60
60
Vertical average
specific humidity
(b)
90S
90S
180
120
60W
0
60E
120
180
less than 1 g kg
−1
at the poles. In desert regions where there is little water available
in the soil, the specific humidity is less (Fig. 9.15a). The total amount of water in
the whole atmospheric column (in kg m
−2
), which is sometimes (wrongly) called
the precipitable water, is, in numerical terms, approximately proportional to the
vertically integrated specific humidity. Figure 9.15b shows that precipitable water
also decreases from the equator to the poles and is higher over oceans than land.
This figure also shows that the penetration of moister maritime air into continents