Geoscience Reference
In-Depth Information
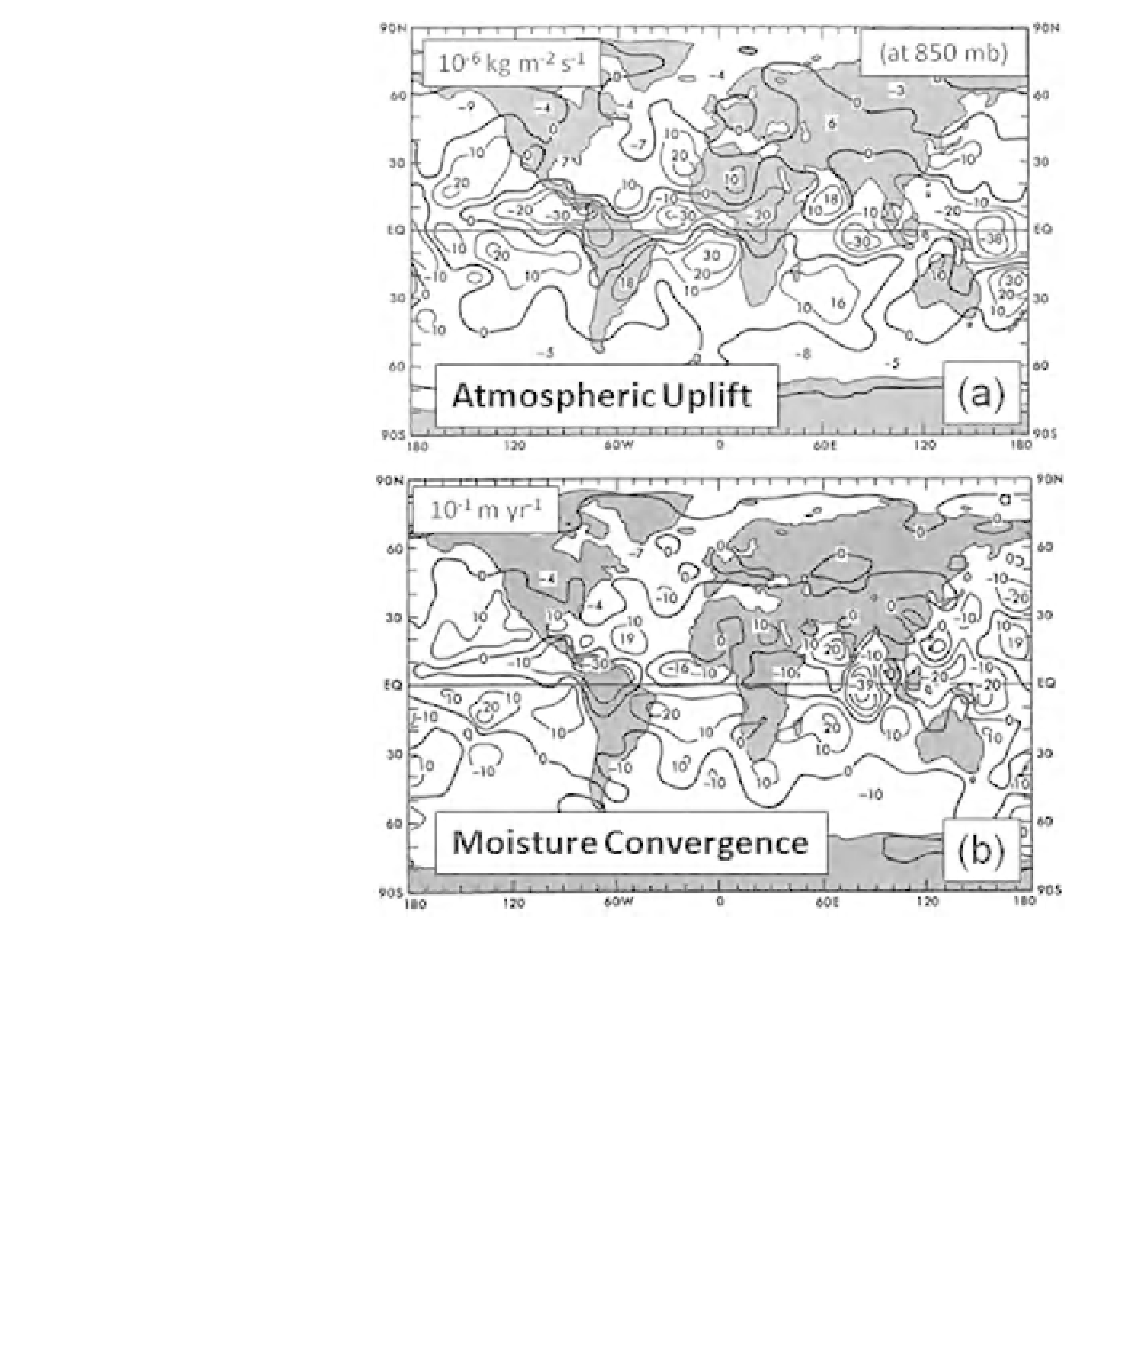
Figure 9.16
Global
distributions of annual
average (a) vertical transport
of water vapor at the 85 KPa
level in units of 10
−6
kg m
−2
s
−1
,
negative values indicate
transport upwards; and
(b) horizontal water vapor
transport in units of 0.1 m
yr
−1
. (Redrawn from Peixoto
and Oort, 1992, published
with permission.)
in westerly airstreams at middle latitudes is influenced by topographic features
such as the Rocky Mountains and Andes Mountains.
Figure 9.16a shows atmospheric uplift of moisture (and associated cooling) that
is large in the Hadley cell at the equator but also in mid-latitude low pressure sys-
tems. Downward transport is greatest in the subtropical anticyclones. Figure 9.16b
shows areas with large-scale moisture convergence in the atmosphere (where pre-
cipitation is in excess of evaporation) are associated with the river basins of the
world's major rivers.