Geoscience Reference
In-Depth Information
(a)
Annual average streamflow and pressure
90N
−
20
−
40
60N
40
−
40
−
40
0
0
40
60
20
60
30N
20
−
40
0
0
−
40
−
20
−
40
−
80
EQ
0
40
40
30S
60
0
−
40
100
−
60S
Insufficient data
90S
120W
60W
0
60E
120E
180
180
Latitude
(b)
(c)
Northern hemisphere winter
Northern hemisphere summer
90N
90N
−
20
Low
High
20
High
Low
40
60N
100
60N
−
20
0
0
−
100
−
80
40
−
40
40
0
60
Monsoon
flow
60
30N
30N
Monsoon
flow
0
−
120
40
0
−
20
−
20
80
−
40
−
−
20
0
40
20
EQ
0
EQ
80
−
−
40
0
0
0
0
60
40
60
60
40
30S
30S
40
40
80
0
0
0
0
0
100
60
−
100
60S
60S
Insufficient data
Insufficient data
90S
90S
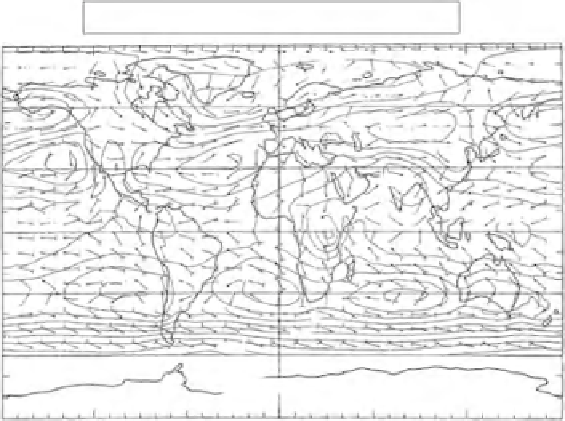
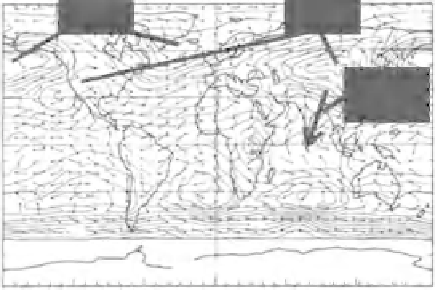
Figure 9.5
Atmospheric streamflow (each barb = 2 m s
−1
) and mean sea level pressure difference (in mb) across the globe
(a) as an annual average, (b) in the northern hemisphere summer, and (c) in the northern hemisphere winter.
(Redrawn from Peixoto and Oort, 1992, published with permission.)
annual average flow pattern (Fig. 9.5a) this influence is most obvious over the
oceans which are aerodynamically smoother than the continents, with annual
average circulation around the high pressure zones apparent at 30°N and 30°S. But
it is possible to distinguish circulation around low pressure at 60°N.
There is a pronounced seasonal variation in the location and strength of the
circulation associated with the Coriolis force within the general pattern of
atmospheric circulation as the location of the overhead Sun moves north and
south. The greater presence of continental surfaces in the northern hemisphere
also has an impact on the seasonal variations in circulation and pressure,