Geoscience Reference
In-Depth Information
90N
a
-400
-400
60N
0
0
200
400
30N
600
EQ
600
-600
400
30S
0
-200
60S
-600
-800
90S
180
120W
60W
0
Latitude
60E
120E
180
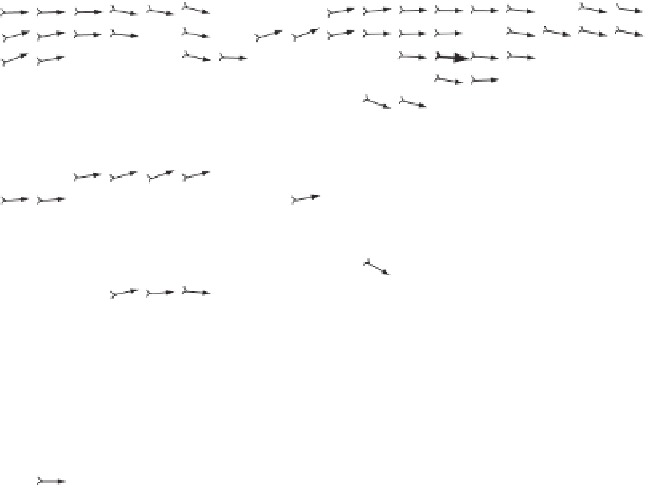
Figure 9.6
Annual average atmospheric streamflow (each barb = 5 m s
−1
) at 200 mb (10 km). (From Peixoto and Oort,
1992, published with permission.)
see Fig. 9.5b and c. In the northern hemisphere summer the oceanic subtropical
highs are farther north and more intense and there are regions of low pressure
over the warm continents which contribute to the creation of monsoon flows.
In the northern hemisphere winter there is a reversal in the pressure differences
between the oceans and the continents with pronounced low pressure regions
in the northern seas reflecting the more persistent presence of storms in this
region.
Mean upper level circulation
Higher in the troposphere, at about 20 kPa or 10 km, the atmospheric circulation
intensifies and simplifies (Fig. 9.6). The most prominent features are bands of
strong westerly winds in both hemispheres in the subtropics and middle latitudes
where the tropospheric jet streams are found. There is some seasonality in this
pattern (not shown), with intensification of the flow in the winter hemisphere. In
the northern hemisphere there is a tendency for the upper level winds to have a