Biomedical Engineering Reference
In-Depth Information
900
800
700
600
500
400
300
200
100
0
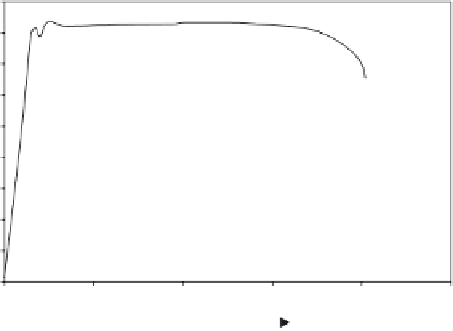
= 118 ksi = 813.58 MPa
= 121 ksi = 834.26 MPa
= 55 GPa
= 19%
0.2% YS
UTS
Modulus
Elongation
0
5
10
15
20
25
Strain (%)
Figure 9.6.
An engineering stress-strain curve for the LENS™ deposited TNZT tensile sample.
[Rajarshi Banerjee et al.
Laser Deposited Ti-Nb-Zr-Ta Orthopedic Alloys
(J. Bio. Mater. Res., 78A
(2), 2006), 298.]
it should be noted that these nanometer-scale precipitation products have been
reported in other conventionally-processed TNZT alloys which exhibited a
similar modulus but a substantially lower strength [30,31]. In the stress-strain plot
shown in Figure 9.6, there is a dip in the plot just after yielding (initiation of
plastic deformation). This dip in the stress can be attributed to the classic yield
point phenomena, which is often observed in case of metals and alloys exhibiting
a
bcc
crystal structure [32] .
9.3.3.3 Deformation Mechanisms.
In order to investigate the reason for
the enhanced strength in greater detail, SEM-OM and TEM studies have been
carried out on the LENS™ deposited samples post tensile testing. A cross-section
OM map of a tensile specimen, recorded from the gauge section, is shown in
Figure 9.7a. The viewing direction is parallel to the tensile axis. This OM map has
been pseudo-colored based on the crystallographic orientations (Euler angles)
of the different regions of the sample. Regions exhibiting the same crystallo-
graphic orientation are depicted in the same color. The map shown in Figure 9.7a
is a direct image of the grains in this sample. The average grain size is
m as
determined by the TSL OIM Analysis software based on ASTM standards for
grain size measurement. In addition to the grain size and morphology, the actual
crystallographic orientations of the different grains can be determined as shown
in the pole fi gures for the
∼
50
μ
β
phase in Figure 9.7b. This pole fi gure corresponds to
grains in a region of 1 mm
×
1 mm of the gage section. The {001}
β
, {011}
β
, {111}
β
,
and, {112}
pole fi gures are shown. These pole fi gures indicate that there is a pref-
erential alignment of the {001} poles for a substantial number of the
β
β
grains
nearly perpendicular to the substrate, or parallel to the tensile axis.
Thus, most of the
axis along the
viewing direction that is parallel to the tensile axis. This preferential alignment of
β
grains seen in Figure 9.7a have a
<
001
>

Search WWH ::

Custom Search