Biomedical Engineering Reference
In-Depth Information
(a)
(b)
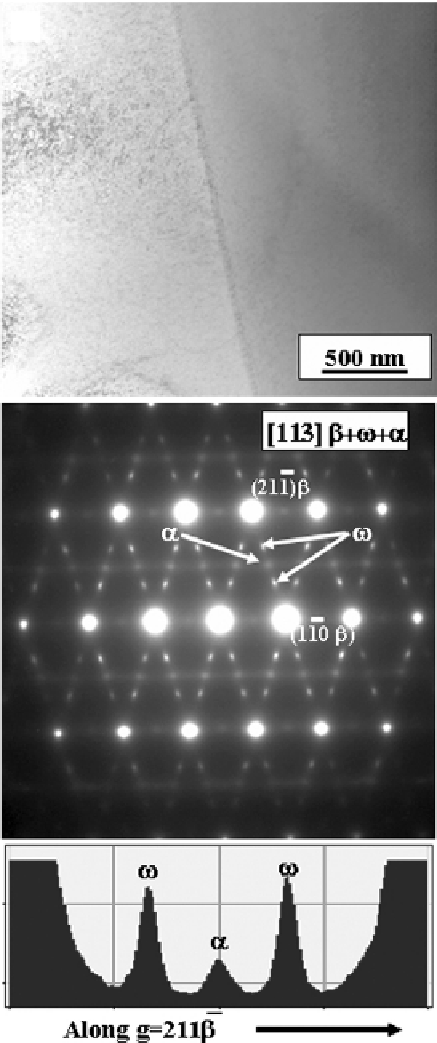
Figure 9.5.
(a) Bright fi eld TEM
micrograph showing a grain
boundary between two grains
of
in the LENS™ as-deposited
sample. (b) [113] zone axis SAD
pattern from the
β
matrix showing
secondary refl ections from the
nanoscale
β
precipitates
present in this sample. An intensity
profi le along the
g
= (21-1)
ω
and
α
axis
is shown below the SAD pattern.
[Rajarshi Banerjee et al.
Laser
Deposited Ti-Nb-Zr-Ta Orthopedic
Alloys
(J. Bio. Mater. Res., 78A (2),
2006), 298.]
β
Search WWH ::

Custom Search