Biomedical Engineering Reference
In-Depth Information
(a)
(b)
(c)
(d)
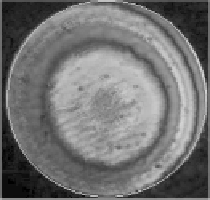
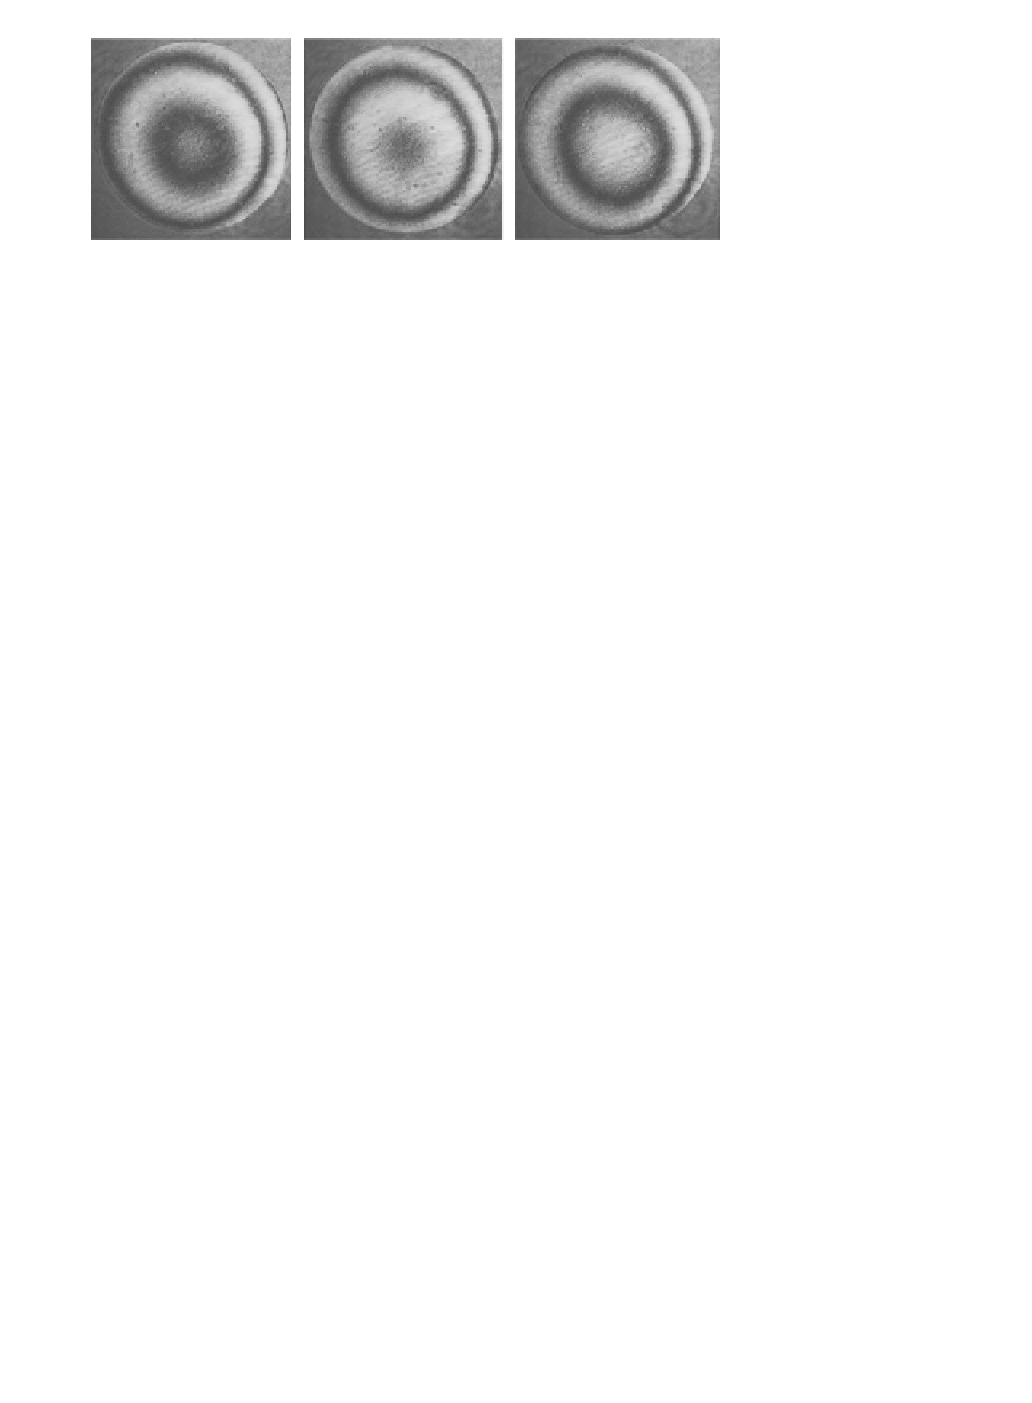
Figure 4.8 (See color insert.)
Phase stepping. (a through c) Raw interferograms where the relative phase is
shited by 0°, 120°, and 240°, respectively. (d) he wrapped phase (color coded) and amplitude (intensity) that was
calculated from the raw images.
4.9 Results for Aberration Measurements
at Low Numerical Aperture
he numerical aperture (NA) of a lens speciies the angle of the cone of rays accepted by the lens. In
general, optical systems with larger NA feature higher resolution and better light-collection eiciency.
Hence they are desirable in confocal microscopy. However, systems of high NA are more susceptible to
aberrations, as we will see. Results for the case of low NA are discussed in this section whereas those of high
NA systems are discussed in
Section 4.11
. A comparison between the two cases is given in
Section 4.15
.
We chose water-based preparations of mouse oocyte cells and blastocysts and
Caenorhabditis elegans
as biological test specimens because of their shape and internal structure. he oocyte cells have a spheri-
cal symmetry with only slight variation in refractive index. he shape of the
C. elegans
is cylindrical,
and the mouse blastocyst is interesting because it has large variations of refractive index due to many
compartments illed with liquids of diferent refractive indices.
Examples for measured wavefronts are shown in
Figure 4.9
. he color of the images represents the
phase whereas the brightness corresponds to the amplitude. In
Figure 4.9a
,
a wavefront corresponding
to a focal position away from the cell is shown. Here the lens positions and the cover-glass correction
have been adjusted to minimize phase variation. hus, the wavefront contains only a small amount of
aberration.
Figure 4.9b
and
c
show examples of aberrated wavefronts. For
Figure 4.9a
and
b
,
an objective
lens with an NA of 0.5 was used. Since this NA is lower than that of the condenser lens (0.6), the pupil
plane image has sharp borders. he white circles mark the pupil diameter of the system over which we
performed the Zernike mode itting.
Figure 4.9c
was recorded using a lens with an NA of 0.8, which was
higher than that of the condenser. Small amounts of light are refracted into angles greater than the aper-
ture angle of the condenser but are still accepted by the larger aperture of the objective. his is indicated
by scattered intensities outside the circle, which are not taken into account for the wavefront analysis.
Strong scattering of the sample, also inside the pupil, requires robust phase unwrapping techniques.
Each wavefront recorded during the scan across the sample is decomposed into its Zernike modal
content. If we make a two-dimensional plot of the modal content for each mode, we can produce a
Zernike pseudo-image of the sample for that particular mode. Such plots are shown for the mouse
oocyte sample in
Figure 4.10
.
Here, the sum of the static and ield-dependent fractions of the specimen-induced aberration is plot-
ted whereas the static aberration introduced by the optical system was removed using the two-step
calibration method described in
Section 4.7
. he irst image within the irst line of
Figure 4.10
shows the
sum of the absolute values of the coeicients 4 through 22 and corresponds to the total aberration apart
from tip and tilt. he Zernike coeicient
M
2
(tip) corresponds to a linear variation of the wavefront in
the horizontal direction whereas
M
3
(tilt) represents a linear slope in the vertical direction. All values
are given in units that are deined such that one unit is equivalent to a wavefront standard deviation of