Biomedical Engineering Reference
In-Depth Information
index.values.(Kam.1998)..Such.refractive-index.maps.can.be.derived.from.microscope.imaging.modes,.such.
as.DIC,.that.record.local.refraction-index.gradients.at.high.spatial.resolutions.(Kam.1998;.King.and.Cogswell.
2004)..he.simulations.were.compared.with.measurements.and.found.to.be.reliable..Computed.PSFs.from.
measured.refractive-index.maps.were.shown.to.deconvolve.efectively.aberrated.luorescent.data.(Kam.et.al..
2001)..Figure.15.7.shows.the.agreement.of.these.ray-tracing.simulations.with.measured.data.
he.coniguration.for.simulating.depth.aberrations.is.shown.in.
Figure.15.8
.
.A.fan.of.rays.from.a point.
source.of.depth.
d
.into.a.sample.medium.is.traced.to.the.back.pupil.plane.of.an.ideal.microscope.objec-
tive.. he. Fraunhofer. integral. is. then. used. to. model. the. image. on. the. CCD. camera.. By. changing. the.
focal.plane.of.the.objective.in.the.ray.tracing,.the.3D.PSF.is.created..Simulated.real-space.3D.PSFs.were.
calculated.by.Fourier-transforming.the.pupil.function.ater.adding.the.defocus.phases.(Stokseth.1969)..
he.Strehl.ratio.was.calculated.from.the.amplitude.and.phase.of.the.pupil.function.(Hardy.1998).and.
was.found.to.be.a.useful.and.sensitive.metric.for.quantifying.of.the.quality.of.correction..he.Strehl.ratio.
is.deined.later.in.the.text.and.can.be.calculated.with.Equation.15.13.
To.calculate.the.efects.of.adaptive.optical.elements,.we.“relayed”.the.rays.emerging.from.the.medium.
by.ideal.lenses,.as.shown.in
.
Figure.15.8
,
.to.each.of.the.adaptive.optical.elements..he.phase.of.each.ray.
was.then.adjusted.by.the.setting.for.the.DM.at.that.position.
With. an. ideal. adaptive. optical. element. placed. in. the. back. pupil. plane. the. depth. aberration. can. be.
completely.corrected.by.applying.Equation.15.1,.as.shown.in.
Figure.15.9
.
.hese.simulations.were.used.to.
evaluate.the.efect.of.various.parameters.on.the.PSF.
Simulations.can.evaluate,.for.example,.intensity.changes.because.of.increased.relection.at.the..sample/
glass.interface.at.high.incident.angles..his.pupil.apodization.efect.was.found.to.have.negligible.efect.on.
PSF.width.and.peak.intensity..Simulating.the.efect.of.print-through.by.adding.small.deviations.from.the.
theoretical.phase.correction,.matching.the.spacing.between.the.actuators,.indicated.a.small..reduction.
in.the.central.PSF.peak.intensity.and.the.appearance.of.difraction.peaks.around.the.PSF,.as.was.indeed.
found. experimentally.. Such. simulations. also. help. us. to. evaluate. the. sensitivity. of. the. .correction. to.
.various.distance.and.aperture.geometrical.parameters.in.the.optical.setup.
(a)
(b)
(c)
(d)
(e)
(f )
(g)
(h)
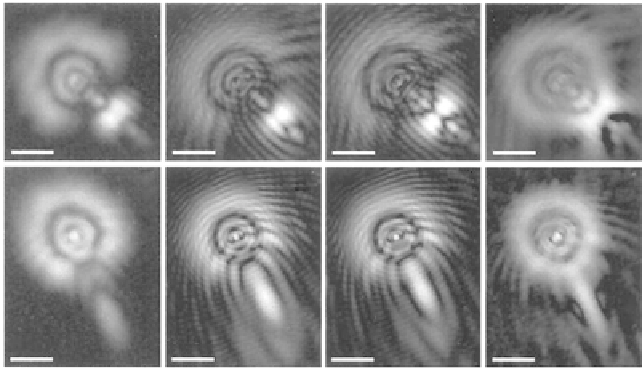
FIGuRE 15.7 (See color insert.)
. Simulated. and. measured. sample-aberrated. PSFs. (Kam. et. al.. 2001).. Refractive.
index.map.of.the.specimen.was.retrieved.from.three-dimensional.digital.image.correlation.(DIC).images.using.LID.
integration.(Kam.1998)..(a-d).Defocused.optical.sections.of.a.bead.aberrated.by.an.oil.drop.below.the.coverslip.at.
3.0 μm.below.focus..(e-h).Optical.sections.of.another.aberrated.bead.at.2.75.μm.below.focus..(a.and.e).A.measured.
image.of.the.0.1.μm.bead..(b.and.f).A.computed.three-dimensional.ray-traced.PSF.using.a.refractive-index.map.from.
the.line-integrated.oil.drop.DIC.data..(c.and.g).A.ray-traced.PSF.using.simulation.of.an.oil.drop.with.uniform.known.
refractive.index..(d.and.h).A.computed.PSF.in.which.the.aberrated.wavefront.calculated.by.ray.tracing.through.a.
simulated.oil.drop.of.uniform.refractive.index.was.applied.to.a.measured,.unaberrated.PSF..Scale.bars.are.2.μm.