Biomedical Engineering Reference
In-Depth Information
(a)
(b)
18,000
13,500
Water-immersion
objective
9,000
4,500
0
Cover glass
No correction (2.6x)
Water
(f )
Slide
Labeled brain slice
15,000
Full correction
System correction
No correction
10,000
System correction (1.5x)
5,000
0
0
5
10
15
20
25
30
Full correction
System correction
No correction
4,000
Full correction
2,000
(c)
0
No correction
System correction
Full correction
0
2
4
6
8
10
12
2,000
Full correction
System correction
No correction
1,500
(d)
No correction
1,000
3,000
2,250
1,500
750
0
500
0
0
2
4
6
8
10
12
No correction
System correction
Full correction
Distance (
µ
m)
2.8
(g)
System correction
(e)
4,500
3,375
2,250
1,125
0
1.4
No correction
System correction
Full correction
Full correction
0
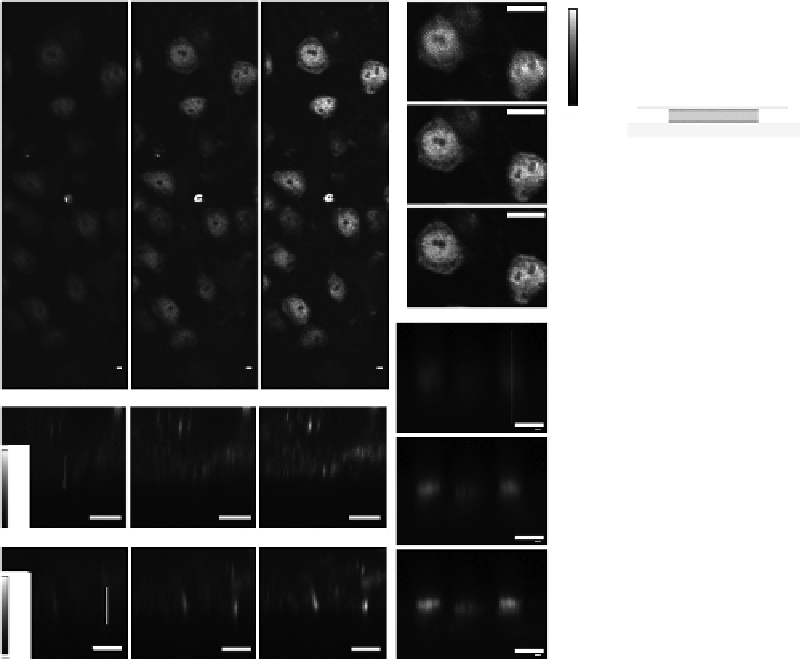
FIGuRE 13.11 (See color insert.)
Aberration.correction.at.the.bottom.of.an.antibody-labeled.300.μm.thick.ixed.
mouse.brain.slice..(a.and.b).Lateral.images.of.a.ield.of.neurons.acquired.with.and.without.correction.as.indicated.
(a),.and.magniied.images.from.one.subield.marked.by.the.rectangle.in.a,.with.all.images.normalized.to.the.same.
peak.intensity.(b)..(c-e).Images.in.the.axial.planes.deined.by.the.yellow.(c),.green.(d).and.blue.(e).lines.in.a..(f).
Intensity.proiles.along.the.gray,.purple,.and.orange.lines.in.c-e..(g).he.corrective.wavefront.in.units.of.excitation.
light.wavelength.(850.nm),.ater.subtraction.of.system.aberrations,.obtained.with.36.subregions.and.direct.phase.
measurement..Scale.bars:.10.μm..(Ji,.N.,.et.al.,.
Nat. Meth
.,.7,.2,.141-147,.2010.)
encountered.during.the.in.vivo.two-photon.imaging.in.the.mouse.cortex.[16]..We.found.that.the.brain-
induced.aberrations.are.temporally.stable.over.a.few.hours,.that.difraction-limited.resolution.can.be.
recovered.at.a.depth.of.450.μm.in.the.cortex.of.the.living.mouse,.and.that,.if.the.aberrating.structure.
is.devoid.of.large.blood.vessels,.the.AO.correction.obtained.at.one.point.inside.the.sample.can.improve.
the.image.quality.over.a.surrounding.volume.of.hundreds.of.microns.in.dimension..he.improvement.
in.both.the.signal.and.the.resolution.allowed.more.dendritic.structures.to.be.detected.(
Figure.13.12a
)
,.
with.ine.dendritic.processes.showing.up.to.ivefold.gain.in.signal.strength.(
Figure.13.12f
)
..As.a.general.
rule,. smaller. structures. show. a. larger. signal. gain. upon. AO. correction. than. larger. structures. (
Figure.
13.12d-f
)..his.is.because.the.enlarged.focal.volume.caused.by.aberration.allows.more.luorophores.to.
be.excited.in.a.large.luorescent.structure,.such.as.a.soma,.thus.partly.compensating.for.the.decreased.
focal.intensity;.whereas.for.small.luorescent.features.such.as.dendrites,.the.full.impact.of.the.reduced.
focal.intensity.is.felt.more.acutely..Indeed,.for.an.aberration-free.imaging.system,.the.total.amount.of.
two-photon-excited.luorescence.in.a.luorescent.sea.is.independent.of.NA—the.decline.of.peak.inten-
sity.is.exactly.compensated.by.an.increase.in.the.focal.volume,.and.thus.the.number.of.luorophores.in.
the.excitation.region.[17].