Biomedical Engineering Reference
In-Depth Information
20
18
16
14
12
10
8
6
4
2
0
0
50
100
150 200
Lateral displacement (
µ
m)
250
300
350
400
Correction at every pixel
Single-value correction
No correction
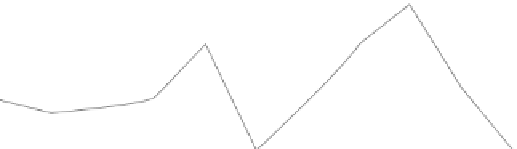
FIGuRE 11.9
Spatial.resolution.measured.across.a.sample.for.one.optimal.mirror.shape.across.the.sample.and.
correction.at.speciic.points.
Depth dependence of CARS signal in agarose
Depth dependence of intensity enhancement
350
3.5
LUT for 734
µ
m
LUT for 460
µ
m
LUT for 315
µ
m
LUT for 178
µ
m
System correction
No correction
300
250
200
3.0
2.5
150
100
50
0
2.0
1.5
1.0
0
100 200 300 400 500 600 700
Penetration depth (
µ
m)
0
100
200 300 400 500 600 700
Penetration depth (
µ
m)
(b)
(a)
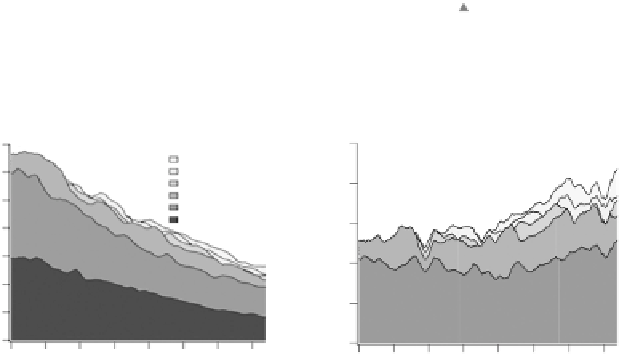
FIGuRE 11.10
AO.improvement.of.CARS.intensity.of.500-µm-thick.agarose-bead.sample..(a).Plot.of.CARS.inten-
sity.as.function.of.depth..(b).Plot.of.enhancement.factors.(intensity.corrected/intensity.uncorrected).as.function.of.
depth..Correcting.for.system.aberrations.only.is.suitable.for.small.image.depths,.while.sample-.and.system-induced.
aberration.correction.achieves.factor.three.improvement.at.high.depths.
single.correction.across.the.slice..hus,.using.a.single.correction.per.slice.appears.to.be.a.practical.solu-
tion.to.selecting.a.mirror.shape.
he.other.practical.area.to.then.consider.is.the.use.of.lookup.tables.such.that.optimizations.are.under-
taken.at,.say,.every.50.µm.and.then.these.values.used.for.the.sections.later.recorded.between.the.opti-
mized. planes. (Wright. et. al.. 2007).. In. an. initial. study. using. agarose. and. polystyrene. beads,. a. CARS.
microscope.image.was.optimized.approximately.every.125.µm.and.then.that.mirror.shape.was.used.for.
the.next.125.µm.
Figure.11.10a.shows.the.averaged.intensity.of.280.µm.×.280.µm.images.(2.5X.zoom).as.a.function.of.
depth.in.the.sample..he.maximum.sample.depth.was.limited.by.the.working.distance.of.the.objective.
to.~500.µm..It.was.observed.that.the.heterogeneous.distribution.of.the.higher.signal.of.the.beads.present.
in.the.sample.did.not.change.the.average.intensity.substantially..In.fact,.the.luctuations.in.the.curves.
arose.from.long-timescale.intensity.luctuations.of.the.laser.used..Figure.11.10b.shows.the.enhancement.
factors.obtained.from.the.same.data.by.dividing.the.corrected.by.the.uncorrected.intensities..his.again.