Biomedical Engineering Reference
In-Depth Information
(a)
d
d
1.0
1.0
NA
NA
0.6
0.8
1.0
1.2
0.8
1.2
0.5
0.5
0.0
0.0
0
1
2
3
4
0
1
2
Slab width
d
(µm)
Slab width
d
(µm)
(b)
20
15
NA
0.8
1.2
10
5
0
0
0.5
1
Slab width (µm)
(c)
(d)
xy
xy
xz
xz
Human cornea (
NA
= 1.2)
Zebrafish yolk (
NA
= 0.75)
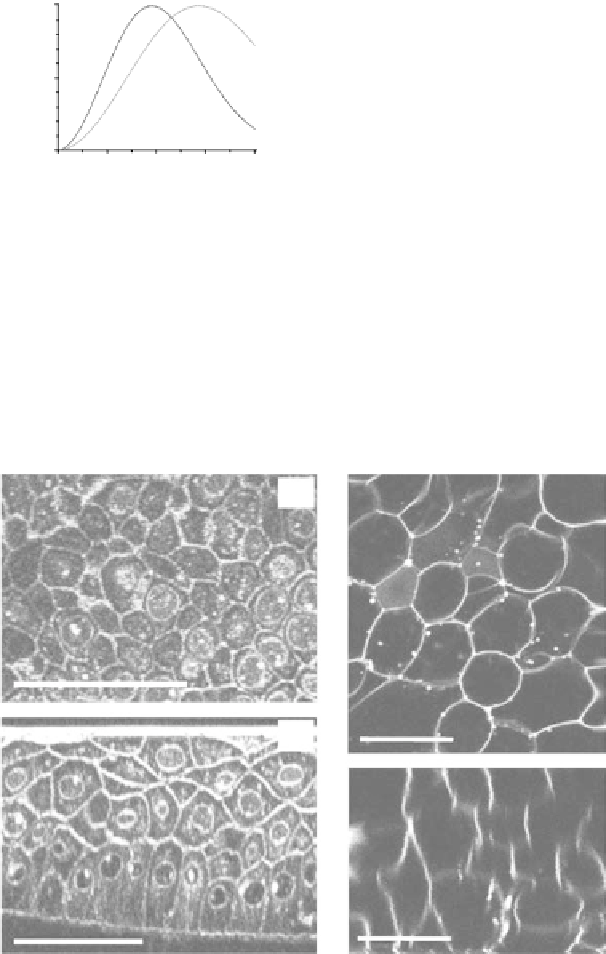
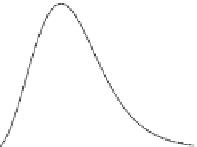
FIgurE 3.9
Influence of the NA in THG microscopy. (a) F-THG signal as a function of the width of a centered
xy
-oriented and
xz
-oriented slabs. (b) Ratio between the maximum signals obtained when scanning the focus across
a
xz
-oriented and a
xy
-oriented slab, for two different excitations NAs. (c,d) Illustration: THG images recorded in
a human cornea and in a zebrafish embryo. Scale bars: 50 μm. (From Aptel F et al. 2010. Multimodal nonlinear
imaging of the human cornea.
Investigative Ophthalmology & Visual Science
51:2459-2465; Olivier N et al. 2010.
Cell lineage reconstruction of early zebrafish embryos using label-free nonlinear microscopy.
Science
329:967-971.
Reprinted with permission from ARVO and AAAS.)