Biomedical Engineering Reference
In-Depth Information
To relate the simulated images to SHG images from cellularized gels, simulated images were
assigned collagen concentrations equal to the number of Gaussian “fibers” in the simulation times
with a scaling factor, with units of milligram per milliliter fiber number. The scaling factor was deter-
mined by counting the number of fiber segments in SHG images of cellularized gels at day 0 of culture.
These SHG images were thresholded at the noise cutoff, despeckled as before to remove the remaining
noise, and a binary opening algorithm was performed in ImageJ to isolate the adjacent fibers. Then,
particle analysis was carried out in ImageJ to count particles larger than 1 μm
2
. It was determined
that the day 0 gel images contained 178 ± 34 fibers (μ ± s.d.), and the averaged gel concentration
was 6.4 mg/mL. Therefore, the scaling factor used for simulated images containing 200-5000 fiber
segments was 0.0356 mg/mL/fiber. A second scaling factor ensured similar brightness of Gaussian
ellipses in simulated images to collagen fibers in SHG images, both on an 8-bit [0-255] scale. The
Gaussian ellipse brightness scaling was chosen such that the intensity of the sparsest simulated image
equaled SHG image intensity from day 0 cellularized gels.
11.4.4 Multiphoton image Parameters Are Sensitive to cellularized Gels
Microstructure
To understand the microstructure-mechanics relationships of cellularized gels during cell-mediated
matrix contraction, the image parameters were measured from SHG, TPF, and textural simulation
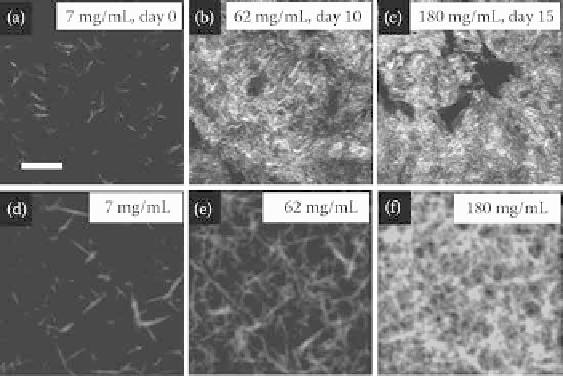
images. Textural simulations of SHG images have a similar appearance to the SHG images of cellu-
larized gels (Figures 11.10a through 11.10c, SHG images; 11.10d through 11.10f, texture simulation).
Particle analysis of SHG images of cellularized gels on day 0 of culture revealed 178 ± 34 fiber segments
(mean ± s.d.). On the basis of this measurement, simulation images containing 200-5000 fiber segments
were assigned concentration values of 7-180 mg/mL. The visual comparison of SHG images and simu-
lations shows a rough parity of texture and collagen fiber density for similar collagen concentrations.
Several signal and image parameters changed during the 16-day
in vitro
culture period. Trends from
the textural simulations suggest that the functional form of SHG image parameters is largely due to
FIgurE 11.10
(a-c) Images of SHG signal from cellularized gels, and (d-f) simulated images from a randomly
oriented fiber network of similar texture to the SHG images. The SHG images are from cellularized gels at three
stages of contraction during floating culture, and the simulated images are of roughly corresponding collagen fiber
density. The estimated collagen concentration for each gel/image is indicated, and the days of culture. The bar rep-
resents 50 μm. (Reprinted from
Acta Biomater,
6, Raub, C. B. et al., Predicting bulk mechanical properties of cel-
lularized collagen gels using multiphoton microscopy, 4657-4665. Copyright 2010, with permission from Elsevier.)