Biomedical Engineering Reference
In-Depth Information
Day 0
Day 10
Day 15
180 mg/mL
(a)
(b)
(c)
5 mg/mL
56 mg/mL
(d)
(e)
(f )
5 mg/mL
62 mg/mL
180 mg/mL
(g)
(h)
1.2
250
400
m
= 0.98
R
2
= 0.88
1
Concentration
Volume
200
300
0.8
150
0.6
200
m
= 0.80
100
0.4
R
2
= 0.77
100
50
0.2
Coarse-structured
Fine-structured
0
0
0
0
2
4 6
Culture time (days)
8
10 12 14 16
0
0.2 0.4 0.6
Normalized concentration
0.8
1
1.2
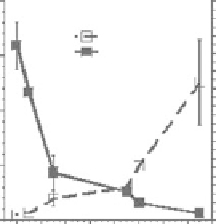
FIgurE 11.9
MPM images of (a-c) fine-structured and (d-f) coarse-structured cellularized collagen gels at three
stages of contraction during floating culture. The estimated collagen concentration for each gel is indicated, and
days of culture. SHG and TPF signals, co-registered in grayscale, reveal collagen and fibroblasts. The bar represents
50 μm. (g) Measured gel volume and the corresponding estimated collagen concentration estimate versus culture
time. (h) Normalized SHG signal versus normalized collagen concentration for fine- and coarse-structured cel-
lularized gels in various stages of contraction during free-floating culture. The linear best-fit slopes and
R
2
values
are indicated. (Reprinted from
Acta Biomater,
6, Raub, C. B. et al., Predicting bulk mechanical properties of cel-
lularized collagen gels using multiphoton microscopy, 4657-4665. Copyright 2010, with permission from Elsevier.)
were distributed normally, with mean and standard deviation determined from
n
= 50 line-segment
measurements from SHG images of real collagen gels. Gaussian peak intensity was directly related
to the length and width, so that larger fiber segments proportionally possessed more intense signal.
Furthermore, the fiber edges were defined where the signal fell to 1/
e
2
times the maximum intensity of
each Gaussian function. The simulated fiber areas and intensities were determined so that SHG images
from cellularized gels at day 0 of culture would have similar mean intensity and signal area fraction
to the simulated image of the corresponding fiber number density. Fiber orientations were distributed
uniformly through 360° and were positioned at random locations within a 512 × 512 pixel matrix (the
same size as the images from the cellularized gel imaging study). The intersecting fibers were allowed to
superimpose, creating a linear relationship between the mean image intensity and fiber number density,
as well as creating a reasonable approximation to the texture of SHG images from cellularized gels con-
taining ~4-200 mg/mL collagen.