Biomedical Engineering Reference
In-Depth Information
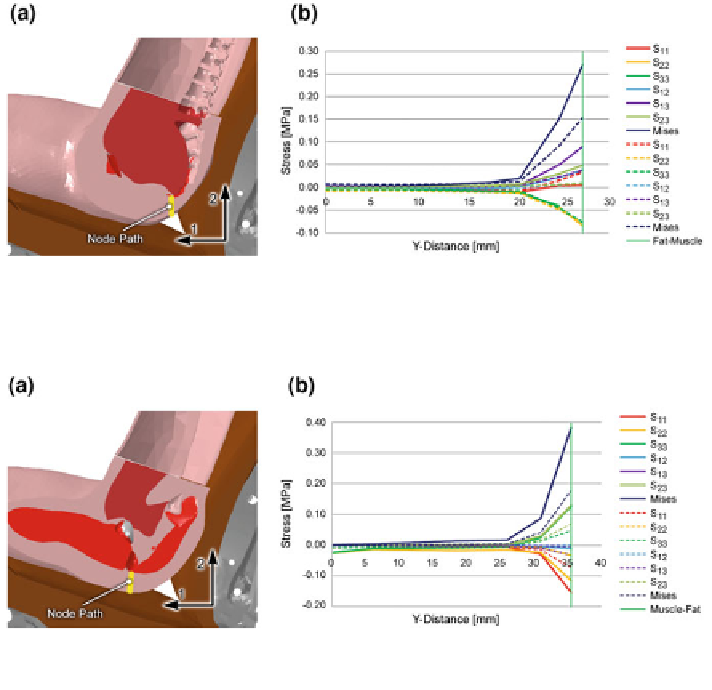
Fig. 7.79
a Stress path 5 (tail bone tip) according to Fig.
7.78
a and b stress profiles S
ij
along the
path
Fig. 7.80 a Stress path 3 (ischial tuberosity) according to Fig.
7.78
a and b stress profiles S
ij
along the path
distinct regions emerged where peak stress occurred, Fig.
7.78
a. In addition,
in Fig.
7.78
b, the peak stress values for stresses S
ij
(i, j = 1, 2, 3) resulting from
mechanical interaction with the non-optimized and the optimized seat cushion are
compared. All tissue stresses, except tensile stress S
11
and (negative) shear stress
S
23
, were reduced at the particular locations as a result of the optimized cushion
design.
Stress profiles along two nodes paths: Figs.
7.79
and
7.80
provide information
about the progression of tissue stress, evaluated along two arbitrarily chosen paths in
the buttocks region, initiating at skin level and ending at the tip of the tailbone and
the ischial tuberosity. The stress curves resulting from the interaction simulation
with the non-optimized seat cushion are displayed as continous lines and the dashed
curves represent the interaction simulations with the optimized seat cushion.
Generally, all tissue stress components at the ischial tuberosity were reduced.
This however, did not apply for the stress components S
11
and S
22
at the tip of the