Biomedical Engineering Reference
In-Depth Information
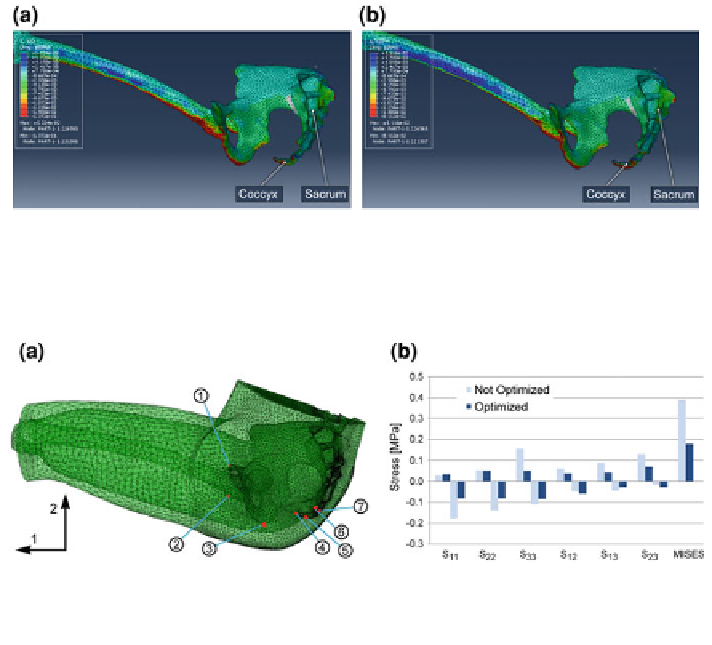
Fig. 7.77 Vertical direct stress S
22
distribution at the bone level from different perspectives due
to mechanical interaction between the female Boss-Model and the non-optimized (a) as well as
the optimized transopt cushion variation (b)
Fig. 7.78 a Tissue peak stress locations due to mechanical interaction between buttocks and a
seat cushion, a overview (1: pubic bone, 2: femur, 3: ischial tuberosity, 4 and 7: tailbone),
b comparison of tissue peak stress prior to and after topology optimization
planes, and employing plane-strain models, an optimized seat shape was generated
in 3D, cf.
Sect. 7.3.1.3
. This was accomplished by extrusion of either the opti-
mized transversal shape along the optimized sagittal contour or vice versa, leading
to the 3D-cushion shape, as depicted in Fig.
7.75
.
7.3.2.2 Tissue Stress Analysis
Figure
7.76
depicts the tissue stress distribution at skin level, at the fat-muscle
interface and at the bone surface resulting from mechanical interaction between a
female Boss-Model and the non-optimized seat cushion, Fig.
7.76
a-c, as well as
the optimized transopt cushion variation, Fig.
7.76
d-f. Analogue to the mechan-
ical interaction involving the male Boss-Model, at skin level and at the fat-muscle
interface significant reduction of tissue stress occurred after optimization.
Stress reduction was achieved at the bone surface beneath the ischial tuberosity,as
was intended (cf. Figs.
7.76
,
7.77
).
As a result of the mechanical interaction between the female Boss-Model and
both car seat cushions, the basic design and the optimized transopt variation, seven