Biomedical Engineering Reference
In-Depth Information
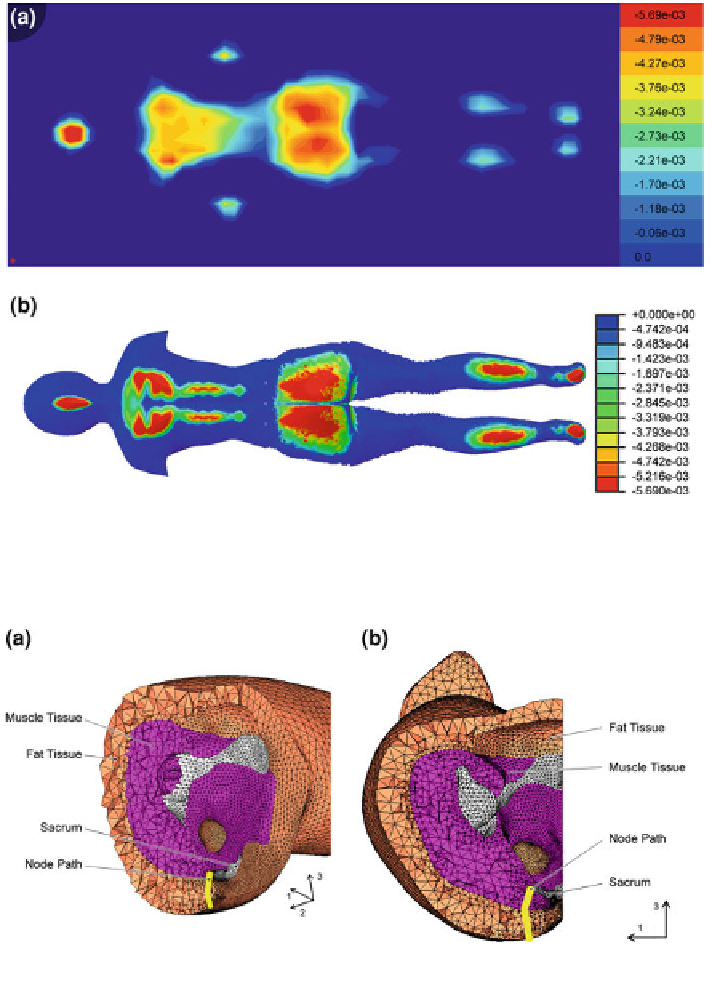
Fig. 7.33 Comparison of interface contact pressure distribution of the female volunteer and the
foam material H
ME
7 at maximum membrane pressure of 20 mbar: a test and b simulation
Fig. 7.34
a Node path 6 and b node path 5 indicated by yellow
markers
To show (internal) mechanical tissue stress at membrane internal air pressures of 10
and 20 mbar, the normal stress component S
33
and the shear stress component S
13
have
been evaluated along path 5 (tailbone to skin) and path 6 (coccyx to skin) beginning at
the point of maximum normal and shear stress, respectively, cf. Fig.
7.34
.