Biomedical Engineering Reference
In-Depth Information
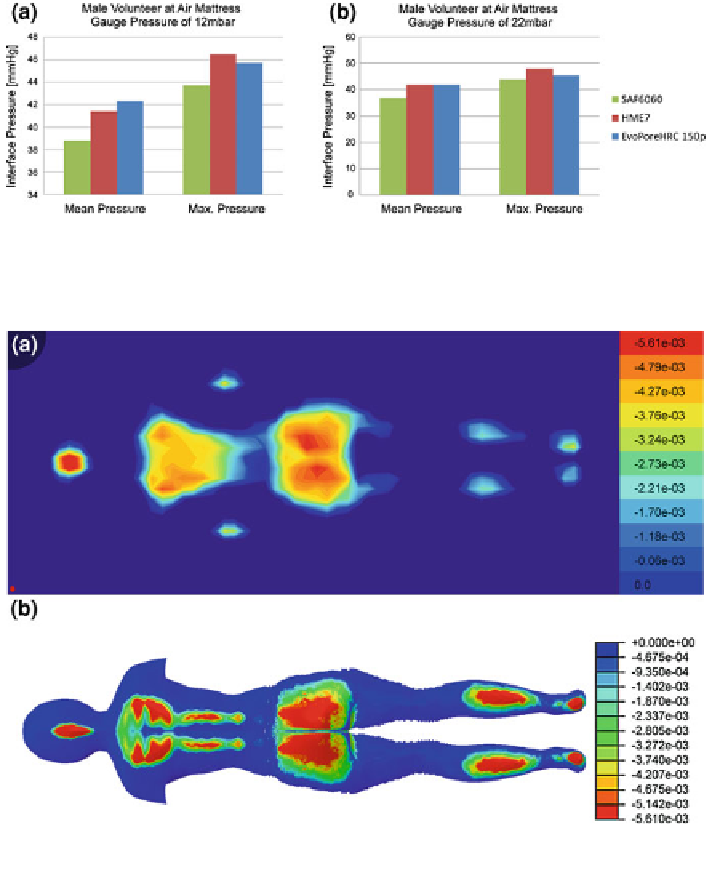
Fig. 7.31 Comparison of interface contact pressure of the male volunteer and the system LS2
related to the mattress material at a 12 mbar and b 22 mbar membrane internal air pressure
Fig. 7.32 Comparison of interface contact pressure distribution of the female volunteer and the
foam material H
ME
7 at minimum membrane pressure of 10 mbar: a test and b simulation
minimum and maximum membrane internal air pressure. Half model symmetry
was employed in the simulation model, and stress contour plot results were pre-
sented as a full model image by mirroring the half model values. This does
generate some difference between pressure mapping results and simulation since
the experiments cannot reproduce full symmetry as is apparent in Figs.
7.32
a and
7.33
a. Furthermore, sensor mats have unknown intrinsic material behaviour and
are placed between the subject and the support surface, possibly falsifying the
measured results.