Biomedical Engineering Reference
In-Depth Information
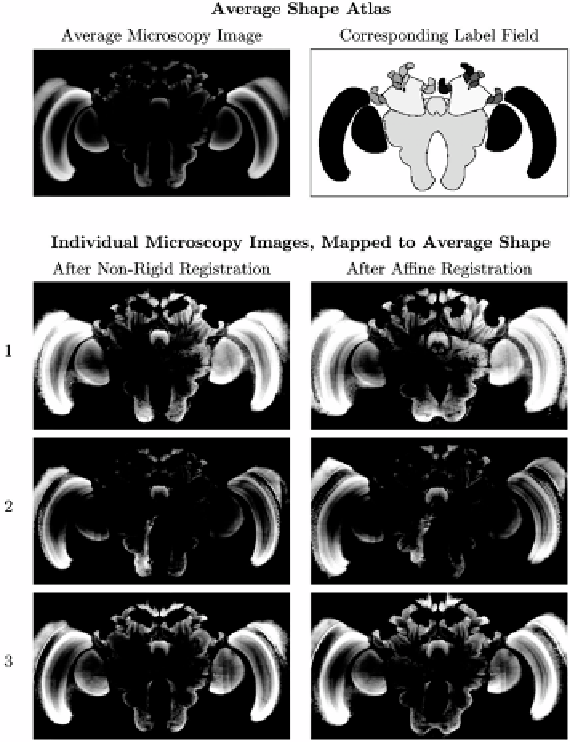
Figure 11.10: Comparison of individual microscopy images and average shape
atlas. Note that the average microscopy image of the average shape atlas also
has a better signal-to-noise ratio and generally fewer artifacts than the origi-
nal individual microscopy images (three randomly selected examples shown as
rows 1 through 3 in this figure).
11.4.3.4
Noise and Artifacts in the Average Atlas
In Fig. 11.10, we compare some individual images that were used to build the
average shape atlas with the average shape atlas itself. It is easy to see that, in
addition to representing an average shape, the average atlas also comes with an
average microscopy image. The latter is easily generated by averaging the gray
values of the appropriately deformed original microscopy images. The average