Biomedical Engineering Reference
In-Depth Information
1.15
Value
of the
similarity
measure
1.1
result at
grid level 5
result at
grid level 6
1.05
1
result at
grid level 7
0.95
0.9
0.85
0.8
0.75
0.7
Registration process
rigid registration
0.65
0
0.5
1
1.5
2
2.5
3
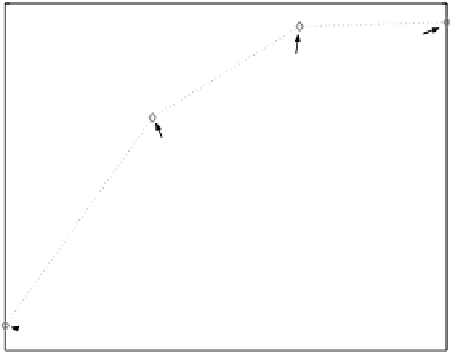
Figure 8.21:
Evolution of the similarity measure. As the hierarchical estimation
is performed, the similarity increases, which means that the volumes are more
accurately registered.
where
TP
,
TN
,
FP
and
FN
, respectively, denote the number of true positive,
true negative, false positive, and false negative points.
These numerical results are shown in Table (8.2). At the end of grid level 5,
we manage to recover more than 95% of the segmentation. This result is satisfac-
tory, due to the use of binary classes, and due to a simple trilinear interpolation
scheme that causes artefacts [108].
Real Data.
We have performed the algorithm on real data (see Fig. 8.22).
The patient has a cyst and a bone tumor, therefore the multiple interfaces
(air/cyst/bone) introduce large distortions that are visible after rigid registra-
tion. For instance, on the left hemisphere, distortions are clearly visible on the
posterior part of the cyst.
There are many artefacts in this fMRI acquisition: there has been signal
saturation and signal drops (visible in the cyst and in the border of the skull).
This illustrates the difficulty of registering real clinical data. Although quality of
the results is quite difficult to quantify, we can see that the cyst (on the axial
view) and the ventricles (on the sagittal view) are better aligned after non-rigid
registration.


