Biomedical Engineering Reference
In-Depth Information
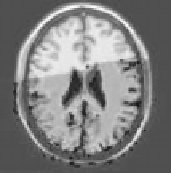
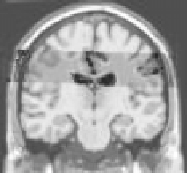
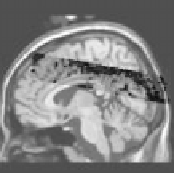
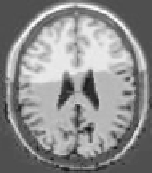
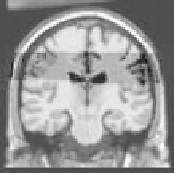
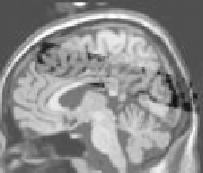
Figure 8.20:
Results of the registration on simulated data. Top: results after rigid
registration. Distortions are visible on axial view (ventricles) and on coronal
view (sagittal mid-plane). Bottom: results after performing a 3D multimodal
non-rigid registration. Misregistration is significantly reduced (see ventricles on
axial view for instance).
In Fig. 8.21, we present the evolution of the similarity measure, computed
for all the volume. As the hierarchical estimation is performed, the similarity
increases, which means that the dependence between the volumes to be regis-
tered also increases, leading to a more and more accurate registration. This is a
numerical confirmation of visual assessment.
At this stage, the evaluation is not completely fair, since the criterion is re-
lated to the similarity used to drive the registration process. As we have the
segmentation of the phantom (gray matter and white matter classes), we can
evaluate objectively the registration process. We deform the segmentation vol-
umes as described at the beginning of section (8.3.3). We can assess the quality
of the registration by computing overlapping measures (specificity, sensitivity
and total performance, see [142] for tutorial) between the initial classes and the
deformed classes, once registered with the estimated deformation field. Let us
recall that:
⎧
⎨
sensitivity
=
TP
/
(
TP
+
FN
)
specificity
=
TN
/
(
FP
+
TN
)
total performance
=
(
TP
+
TN
)
/
(
TP
+
FP
+
TN
+
FN
)
,
(8.6)
⎩