Biomedical Engineering Reference
In-Depth Information
300
250
200
150
100
50
0
0
50
100
150
200
250
300
300
250
200
150
100
50
0
0
50
100
150
200
250
300
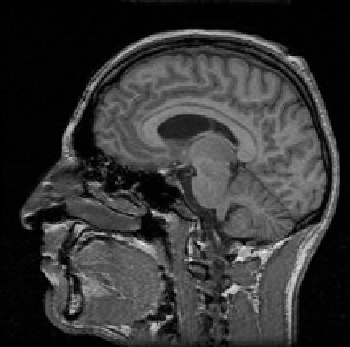
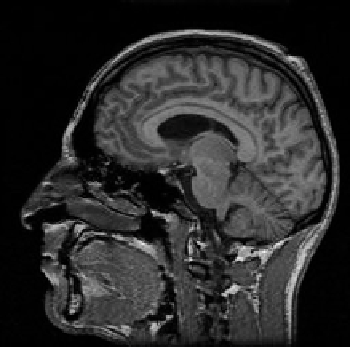
Figure 8.6: Intensity correction using the stochastic expectation maximization
(SEM) algorithm. The corrected source volume is presented, as well as the
parametric intensity correction (to be compared with the identity function).
The histogram has been modeled by five Gaussian distributions (top) and seven
Gaussian distributions (bottom). Points represent the mean of Gaussian laws
that model the histogram.
Corrected source volumes and parametric correction functions are pre-
sented. The corrected volume seems visually more similar to the target volume
(when comparing intensities of corresponding tissues). Modeling the histogram
with seven classes seems more adequate in this context. This is actually more
relevant from an anatomical point of view and provides more sample to esti-
mate the correction function. The experiments we have conducted so far do not