Biomedical Engineering Reference
In-Depth Information
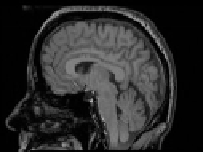
Source MR image
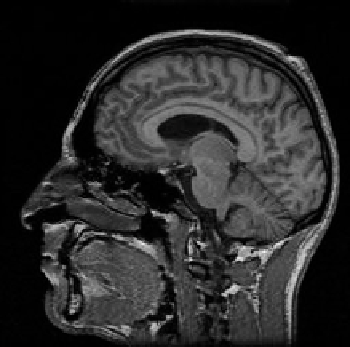
Target MR image
Figure 8.4:
MR images of different subjects. The intensity of tissue classes is
different for source (top) and target (bottom) volume.
300
250
200
150
100
50
0
0
50
100
150
200
250
300
300
250
200
150
100
50
0
0
50
100
150
200
250
300
Figure 8.5:
Intensity correction using the expectation maximization (EM) al-
gorithm. The corrected source volume is presented, as well as the parametric
intensity correction (to be compared with the identity function). The histogram
has been modeled by five Gaussian distributions (top) and seven Gaussian dis-
tributions (bottom). Points represent the mean of Gaussian laws that model the
histogram.