Biomedical Engineering Reference
In-Depth Information
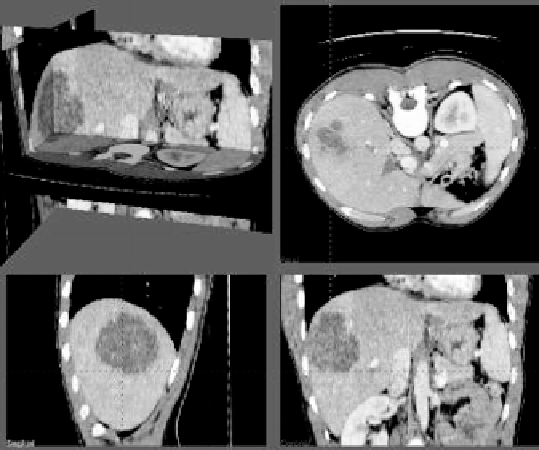
Figure 7.10:
An abdominal CT image.
[6]. The Canny edge detector produces a large number of edges. First, weak
edges were removed by interactively varying the gradient threshold value and
observing the obtained edges. Then, an edge surface of interest was selected
by pointing to the surface with the mouse and extracting it from the image. In
these figures, results of the initial segmentation are shown after RaG surface
fitting by the least-squares method. RaG surfaces were then interactively re-
vised as needed while viewing the overlaid surface and volumetric image. Final
segmentation results are shown in the third column of Fig. 7.9.
Another set of examples is shown in Figs. 7.10 and 7.11. Figure 7.10 is an
abdominal CT image. Segmentation of different regions via intensity threshold-
ing or edge detection, subdivision of obtained regions to triangular meshes, and
fitting of RaG surfaces to the mesh vertices are shown in Fig. 7.11. Regions cor-
responding to the liver, one of the kidneys, and the spleen were selected one at a
time and, after representing each by a RaG surface, were edited to remove inac-
curacies in segmentation. Final segmentation results are shown in the column
on the right in Fig. 7.11.
The time needed to obtain an initial segmentation and the time needed to
modify the initial segmentation to obtain the final result vary from image to
image. In the image shown in Figs. 7.9 and 7.11, approximation of the initial