Biomedical Engineering Reference
In-Depth Information
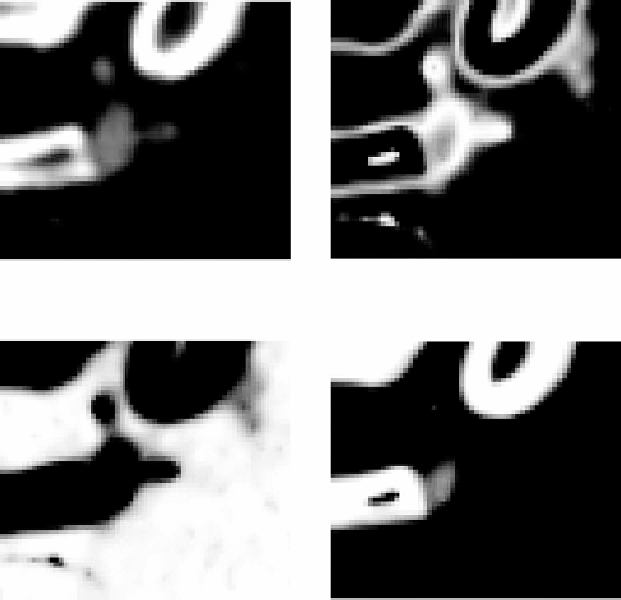
(a)
(b)
(c)
(d)
Figure 5.11: Cross-section with the probability density function estimated from
the Gaussian model. Brighter areas correspond to higher probabilities. (a) Orig-
inal gray level image. (b-d) Probability density functions for vessel, background
and bone, respectively.
information from the image were required to improve them. Most of the ap-
proaches found in the literature use a Gaussian model for the intensities of each
region. Figure 5.11 shows an example of the tissue probability density functions
modelled by Gaussian distributions. Compared to Fig. 5.6, it can be appreciated
that the probability of vessel is higher in the transition between bone and back-
ground. The probability of bone in the interior of the aneurysm is also higher.
Background tissue inside the bone has high probability for vessel tissue. The
introduction of these features in the region-based term makes the model less
robust and very sensitive to the parameter settings of the algorithm, which have
to be tuned for each patient to compensate the effect of the misclassification.