Biomedical Engineering Reference
In-Depth Information
4
4
limits of agreement
limits of agreement
2
2
bias
bias
0
0
−
2
−
2
−
4
−
4
−
6
−
6
1
2
3
4
5
6
7
1
2
3
4
5
6
7
mean [mm]
mean [mm]
(a)
(b)
width
width
6
6
limits of agreement
limits of agreement
4
4
2
2
bias
bias
0
0
−
2
−
2
−
4
−
4
−
6
6
−
2
4
6
8
10
12
14
16
18
2
4
6
8
10
12
14
16
18
mean [mm]
mean [mm]
(c)
(d)
depth
depth
6
6
limits of agreement
limits of agreement
4
4
2
2
bias
bias
0
0
−
2
−
2
−
4
−
4
−
6
−
6
2
4
6
8
10
12
14
16
18
2
4
6
8
10
12
14
16
mean [mm]
mean [mm
]
(e)
(f)
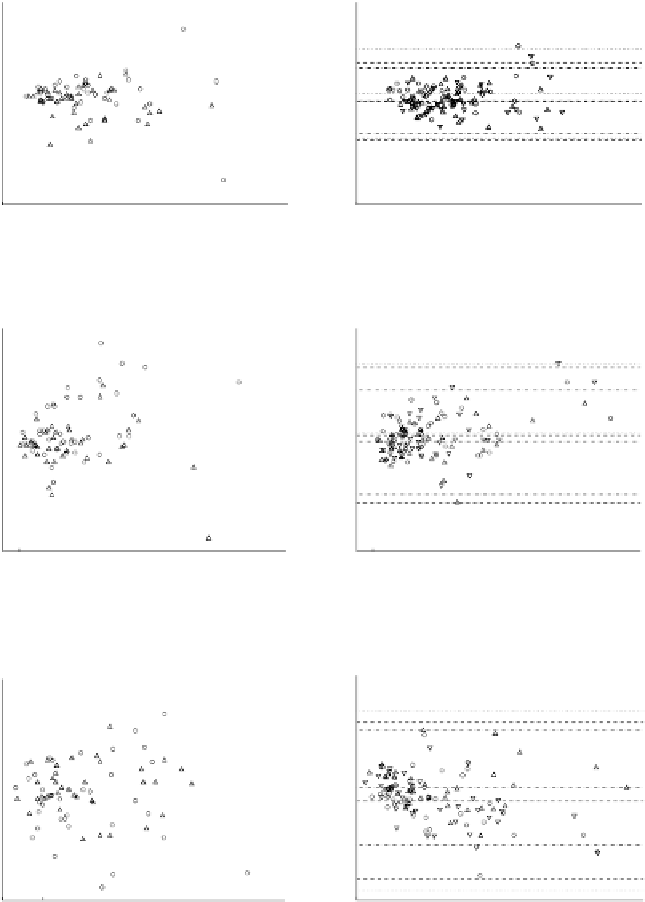
Figure 5.10:
In the first column, Bland-Altman graphs comparing the two man-
ual measurements of each observer. Symbols
and
stand for ObsI and ObsII,
respectively. In the second column, Bland-Altman graphs comparing the inter-
session measurement for manual and computerized methods. Symbol
stands
for ObsI vs ObsII study,
∇
for ObsI vs MB and
for ObsII vs MB. In all plots the
horizontal axis of the plot indicates the average and the vertical axis indicates
the difference between measurements. The bias and the limits of agreement are
indicated.