Biomedical Engineering Reference
In-Depth Information
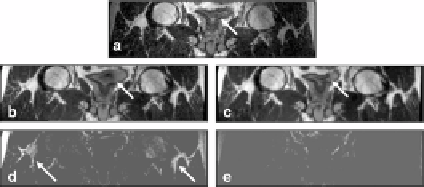
Figure 3.13:
Comparison of registration quality for rigid body and warping reg-
istration. The reference image (a) was acquired with a relatively empty bladder
(arrow). Images (b) and (c) are from the floating volume acquired with a full
bladder following rigid body and warping registration, respectively. Images (d)
and (e) are the absolute difference images between the reference and registered
images, respectively. Bright regions following rigid body indicate misalignments
(d) that are removed with warping (e). Images (d) and (e) are displayed using
the same grayscale window and level values. Images are coronal slices from S3
volumes shown in Fig. 3.12.
pairs fit these criteria. In all such cases, rigid body registration worked as well
as warping. There were no noticeable deformations in the pelvis, and prostate
centroids typically displaced less than 1.0 mm between the two registered vol-
umes. Note that this was obtained even though subjects always got up from the
table and moved around before being imaged again.
3.3.4.6
Quantitative Evaluation of Non-Rigid Registration
Figure 3.14 shows the correlation coefficient and mutual information values
between registered volumes. Warping increased CC and MI values in every
case, and a paired two-tailed
t
-test indicated a significant effect of warping
at
p
<
0
.
5%. The most significant improvement was in the case of treatment-
diagnosis where improvements in CC and MI were as high as 102.7% and 87.8%,
respectively.
Statistics of image differences following rigid body and non-rigid registra-
tion are shown in Fig. 3.15. Warping reduces the absolute intensity difference
between corresponding voxels (Fig. 3.15a), and the mean across all image vol-
umes is only 4.2 gray levels, a value corresponding to only 4.7% of the mean
image value of 90. We used the absolute intensity difference because signed