Biomedical Engineering Reference
In-Depth Information
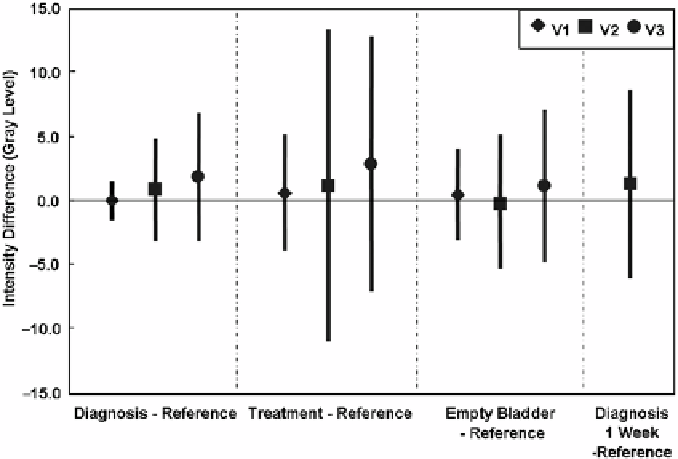
Figure 3.5:
Image intensity difference between registered volume pairs. Plotted
are means and standard deviations calculated over the entire volumes. Other
details are given in the legend of Fig. 3.4. Eight out of 10 registrations have a
mean absolute gray level difference less than 1.5 gray levels. Average results are
0.9
±
1.8, 1.5
±
3.9, and 0.4
±
2.6 gray levels, or 1.0%, 1.7%, and 0.4% of typical
mean values of 90 gray levels, for diagnosis-reference, treatment-reference, and
empty bladder-reference, respectively.
1
.
5
±
0
.
2 mm, very nearly the value obtained with MI registration. Hence, the
“error” reported for MI is probably overestimated due to landmark location error.
This analysis was prompted by ideas in a previous report [22] that numerically
demonstrated the relationship between point localization uncertainty and point-
based registration uncertainty.
Figure 3.5 shows image intensity differences between reference and regis-
tered volumes. The means are quite small with 8 out of 10 registrations giving
a mean absolute value
<
1
.
5 gray levels, or only 1.7% of typical mean values of
90 gray levels for these 3D MR acquisitions. Again, the only consistent outliers
occur when we compare the treatment position to the reference. For the case
diagnosis-reference, extremely small image differences are found with V1 giv-
ing 0
.
1
±
1
.
6 gray values, a standard deviation that compares favorably to the
expectation from image noise alone, or 1.5 gray values. For this volume pair, the
subtracted images have very little structure except at the skin surface, indicating