Biomedical Engineering Reference
In-Depth Information
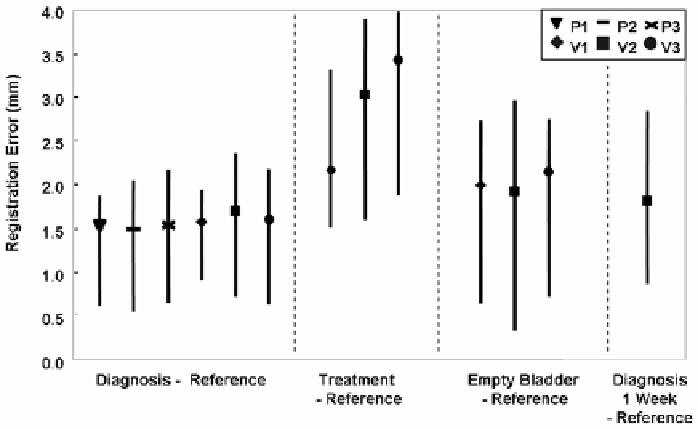
Figure 3.4:
Registration error as determined from bony landmarks. Plotted
are RMS distances as well as maximums and minimums that show the spread
of the data. Conditions along the x-axis such as the “treatment” position are
described in Methods. P's and V's refer to patients and volunteers, respectively.
Averaging data across all subjects for the best case (diagnosis-reference) gives
1.6
±
0.2 mm. Averages are 2.9
±
0.7 mm and 2.0
±
0.1 mm for treatment-reference
and empty bladder-reference, respectively.
both imaging sessions, labeled diagnosis-reference. The average error across the
three patients and three volunteers is only 1
.
6
±
0
.
2 mm. Consistently larger er-
rors are obtained when we compare volumes acquired in the treatment position
with those in the reference position. Even though the MR acquisition technique
used for the patients gave inferior image quality as compared to that for the
volunteers, errors were small.
Additional error analyses are performed on the volunteer images to assess the
accuracy of point landmark localization. We used images obtained with the rapid
gradient echo sequence, which have improved contrast of the prostate and bony
landmarks and which give us more confidence in measurements. The isotropic
voxels are 1.4 mm on a side, almost as large as the 1
.
7
±
0
.
5 mm error obtained for
the volunteer diagnosis-reference data. We assess the error in localizing the bony
landmarks by performing point-based registration on 4-6 points per volume pair.
The RMS distances after registration averaged across the three volunteers was