Geology Reference
In-Depth Information
The structure contour map of a marker horizon displaced by a branching fault
(Fig. 8.33a) shows two intersecting faults and an abrupt change in throw at the inter-
section. The throw of fault A plus that of fault B is equal to that of C at the branch line.
In this example, the fault plane of A is continuous with the plane of fault C. Contours
on the faults (Fig. 8.33b) show a straight branch line and a region of fault overlap. All
three faults at the branch line could have different strikes.
A good test of the fault interpretation on a map is to measure the throws in the
vicinity of all branch lines and show that the throws of the two smaller faults are equal
to that of the larger fault. If this is not true, the map is wrong. An abrupt change in the
throw of a fault is probably caused by an undetected fault branch (Ocamb 1961) or
relay fault that carries the missing throw.
8.6.3
Splay Fault
Splay faults are minor faults at the extremities of a major fault (Bates and Jackson 1987).
The master fault splits at one or more branch lines to form the splay faults (Figs. 8.34,
8.35). The splays then die out along strike at tip lines. Splay faults distribute the total
Fig. 8.34.
Splay faults (
B
and
C
) at the end
of a master normal fault (
A
)
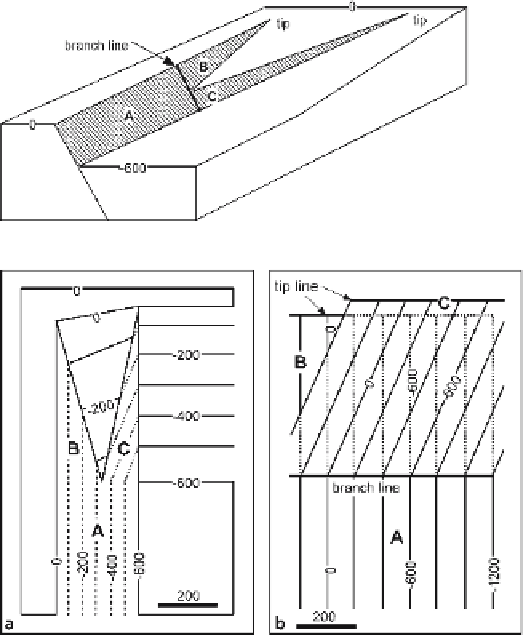
Fig. 8.35.
Structure contour maps of a
splaying normal fault based on
geometry of the structure in
Fig. 8.34. The master fault is
A
,
its continuation into the region
of splay faulting is
B
, and the
other splay fault is
C
. Both
maps are at the same scale.
a
Offset marker horizon.
Solid
contours
are on the marker
horizon and
dashed contours
are on the faults.
b
Portions of
the faults. Contours are
dotted
where they lie below another
fault