Geology Reference
In-Depth Information
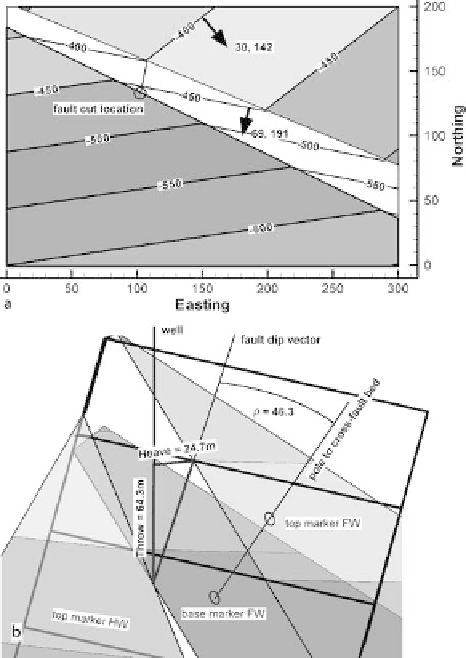
Fig. 8.5.
Stratigraphic separation from
heave or throw.
a
Structure
contour map of offset marker
and fault.
b
3-D oblique view
to NW, including base of
marker at fault cut in FW
(
dark shading
)
As an example, find the stratigraphic separation predicted for a fault cut at the lo-
cation indicated on Fig. 8.5a. At this point the heave is 24.6 m and the throw is 64.5 m,
measured as indicated in Sect. 8.2.1. The cross-fault bedding dip and the fault dip
magnitudes are found from the contour spacings using Eq. 2.22. The dip directions are
perpendicular to the structure contours, giving for the fault,
φ
= 69, 191, and for the
bed,
= 46.3° from Eq. 4.3. Applying either Eqs. 8.1 or 8.2,
the stratigraphic separation is
t
= 47.6 m. This result is shown in a 3-D model (Fig. 8.5b)
in which all the parameters can be measured directly to illustrate and validate the
relationships in Eqs. 7.5-7.6 and 8.1-8.2.
δ
= 30, 142, and the angle
ρ
8.3
Constructing a Faulted Marker Horizon
Placing the trace of faults on the structure contour map of a marker surface generally
begins with a preliminary map of the marker horizon without faults (Fig. 8.6a), then
the faults are mapped and the traces of the faults are found (Sect. 2.7) on the prelimi-
nary marker surface (Fig. 8.6b). The marker surface is separated into hangingwall and