Geology Reference
In-Depth Information
the growth history and are valuable in fault correlation. In an example from Louisiana,
the expansion index diagrams have the same form across the same fault at an interval
about 2.5 miles apart (Fig. 7.35a,b). The values of
E
for the same units are not the same,
but the forms of the expansion index curves are the same. Both crossings of the same
fault show the maximum growth interval to be of the same age. Three different faults
in the same area give three different expansion index diagrams over similar distances
(Fig. 7.35c,d). The maximum growth interval becomes younger to the south. Thus,
similar growth-history relationships can indicate that the same fault has been crossed
and different relationships can indicate that different faults have been crossed.
7.8
Exercises
7.8.1
Fault Recognition on a Map
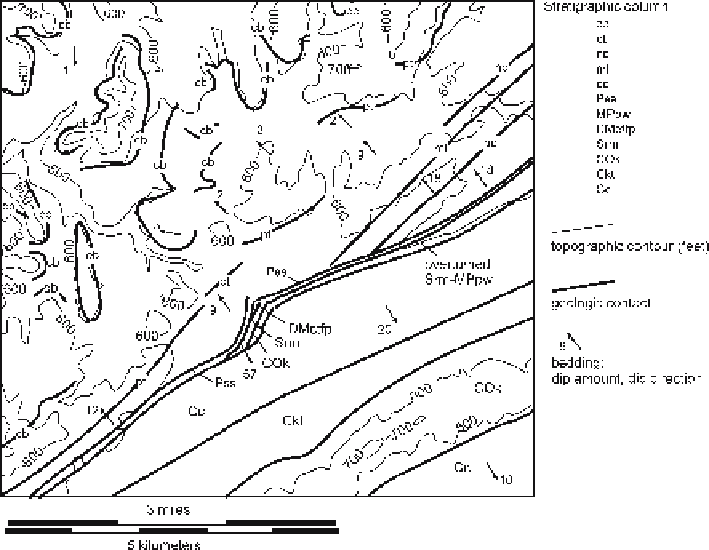
Use the partially complete geologic map of Fig. 7.36, to do the following: Mark all the
faults. Explain the reason for each fault. Indicate the sense of displacement on each fault.
Fig. 7.36.
Geologic map of the Ensley area, Alabama, with fault contacts not marked. (After Butts 1910;
Kidd 1979)