Geology Reference
In-Depth Information
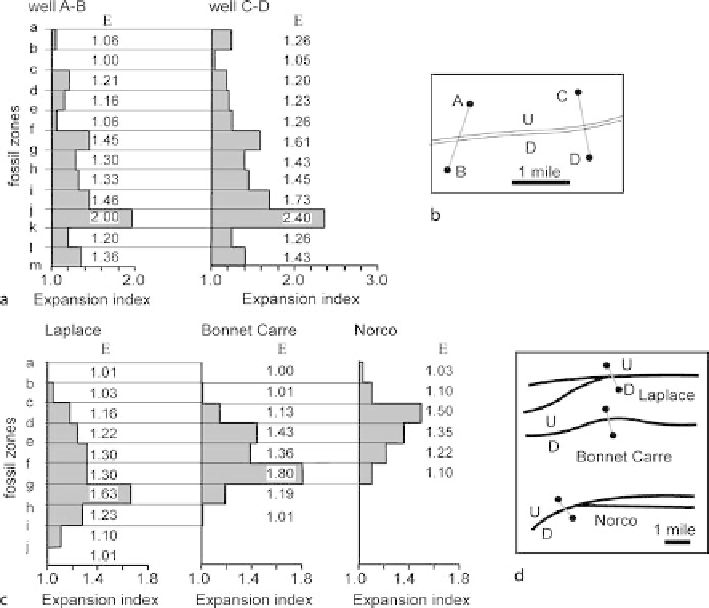
Fig. 7.35.
Expansion index (
E
) diagrams across Louisiana growth faults.
a
Expansion indices from two
crossings of the same fault.
b
Locations of wells used to determine the expansion indices in
a
.
c
Expansion
indices across three adjacent faults.
d
Locations of the wells used to determine the expansion indices
in
c
(after Thorsen 1963)
to about the same degree in both the hangingwall and the footwall curves, it may have
been caused by a later fault that cuts and displaces the fault in question.
Stratigraphic separation diagrams are most widely used for data derived from the out-
crop traces of thrust faults. If the distance coordinate follows the sinuous erosional trace
of a low-angle thrust, some of the stratigraphic variation in thrust levels will be caused by
the changing depths of erosion and reentrants on the fault. To eliminate this source of
variability, it is better to make the diagram follow a straight line or smooth curve that is
either parallel to or perpendicular to the transport direction of the fault (Woodward 1987).
7.7.4
Growth History
The stratigraphic evolution of a growth fault provides another criterion for correlating
fault cuts. A single fault can be expected to have a similar stratigraphic growth history
along its trend. Expansion index diagrams (Sect. 7.6.2) clearly illustrate the details of